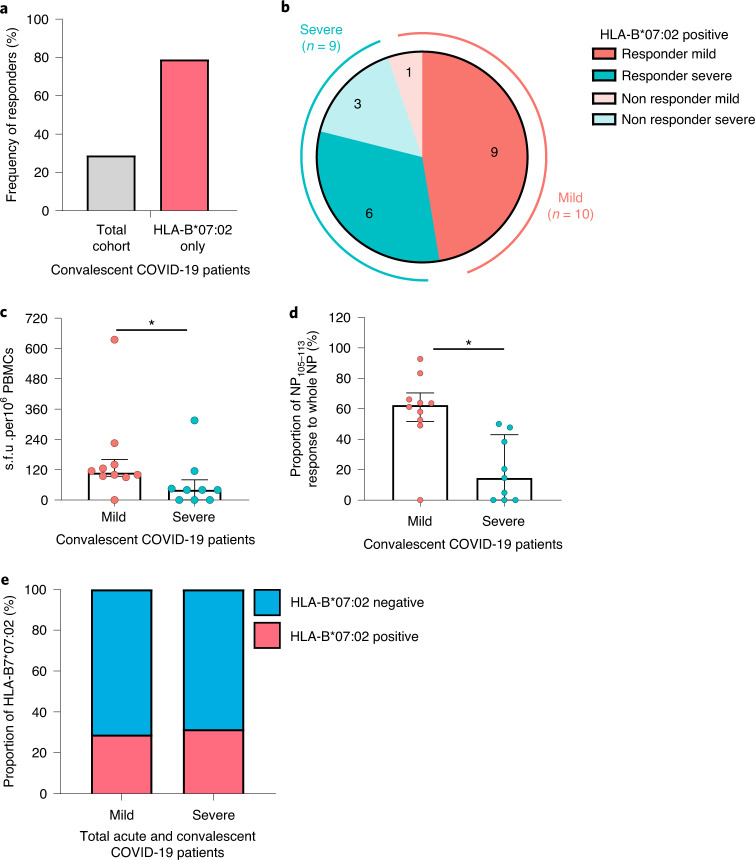
Fig. 1. Frequency and magnitude of response to the NP105–113-B*07:02 epitope in patients with COVID-19.
a, Frequency of convalescent patients with COVID-19 (n = 52 total patient cohort, n = 19 HLA-B*07:02-positive patients only) with T cells responding to NP105–113-B*07:02 epitope stimulation. b, Frequency of HLA-B*07:02-positive responders (n = 15) and nonresponders (n = 4) with mild or severe COVID-19 disease. c, Comparison of the magnitude of the response to the NP105–113 epitope between HLA-B*07:02-positive convalescent patients with COVID-19 (n = 10 mild, n = 9 severe). d, Proportion of NP105-113-specific response to overall NP response (n = 10 mild, n = 9 severe). e, Proportion of HLA-B*07:02 individuals compared with combined total acute and convalescent COVID-19 patients (n = 77 acute, n = 52 convalescent). Data are presented as medians with interquartile ranges (IQRs) (c and d). The Mann–Whitney U-test was used for analysis and the two-tailed P value was calculated: *P < 0.05. s.f.u., spot-forming units.

