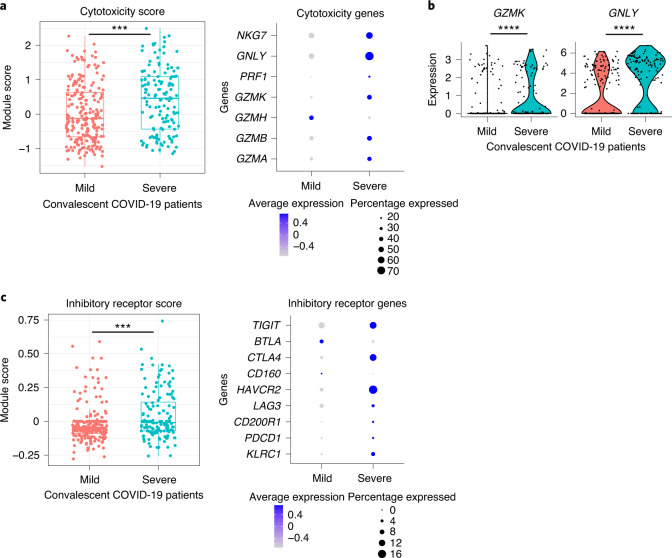
Fig. 2. Characterization of response to the NP105–113-B*07:02 epitope in convalescent HLA-B*07:02-positive patients with mild and severe COVID-19.
a, Gene sets scored based on single-cell gene expression from a SmartSeq2 RNA-seq dataset comprising two mild and two severe convalescent HLA-B7*07:02-positive patients with COVID-19 (n = 208 cells from mild cases, n = 140 cells from severe cases). Scores for cytotoxic gene expression are shown in the box plot (P = 0.00032). Individual genes in the cytotoxic gene set are shown on the right. b, Violin plots showing specific expression of cytotoxic genes GZMK (P = 3.02 × 10⁻⁵) and GNLY (P = 1.41 × 10⁻⁹). c, Box plot showing scores for inhibitory receptor gene set (n = 208 cells from mild cases, n = 140 cells from severe cases); right: individual genes in gene module. For all box plots, the lower and upper hinges represent the 25–75th percentiles, the central line represents the median, and the whiskers extend to the maximum and minimum values that are no greater than 1.5× the IQR. The Mann–Whitney U-test was used for analysis and the two-tailed P value was calculated: ***P < 0.001, ****P < 0.0001.

