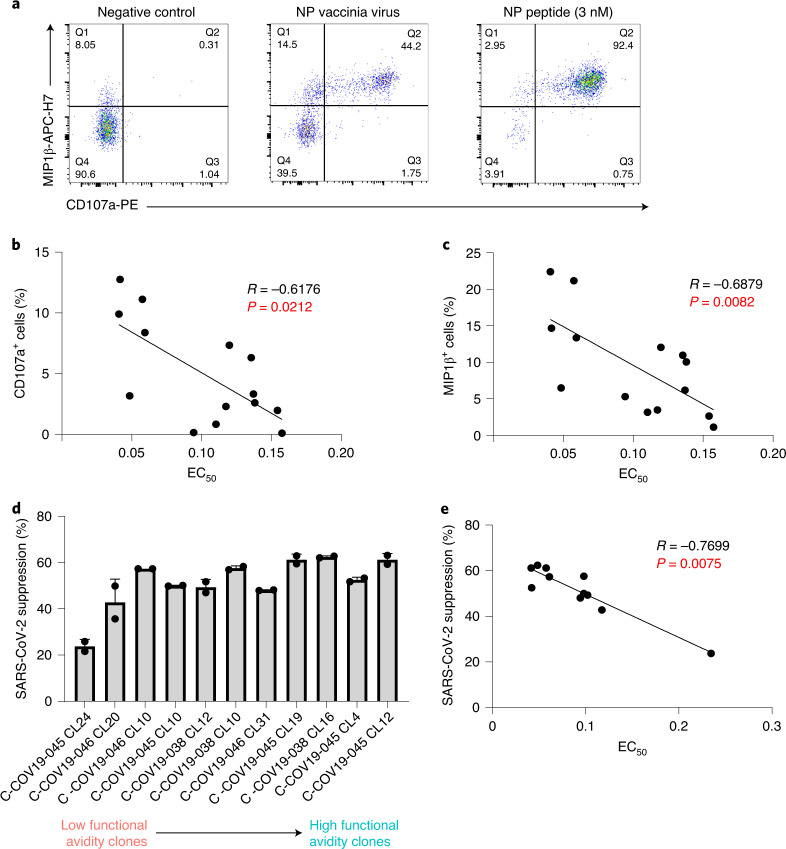
Fig. 6. Correlation between functional avidity and antiviral efficacy in T cell clones.
a, Representative ICS flow cytometry plots measuring MIP1β and CD107a expression on T cell clones incubated with vaccinia virus encoding NP or peptide-loaded (3 nM peptide) antigen-presenting cells. b, Correlation plot between CD107a expression on T cell clones incubated with NP-expressing vaccinia virus and their respective EC50 values (n = 14, R = −0.6176, P = 0.0212). c, Correlation plot between MIP1β production of T cell clones incubated with NP-expressing vaccinia virus and their respective EC50 values (n = 14, R = −0.6879, P = 0.0082). d, Inhibition of SARS-CoV-2 virus replication (Victoria strain) by T cell clones with different EC50 values and differing functional avidity (n = 11). e, Correlation plot between percentage of viral suppression by specific T cell clone and its corresponding EC50 value (n = 11, R = −0.7699, P = 0.0075). Spearman’s rank correlation coefficient was used for correlation analysis with the two-tailed P value. Bar graph is presented as mean ± s.d.

