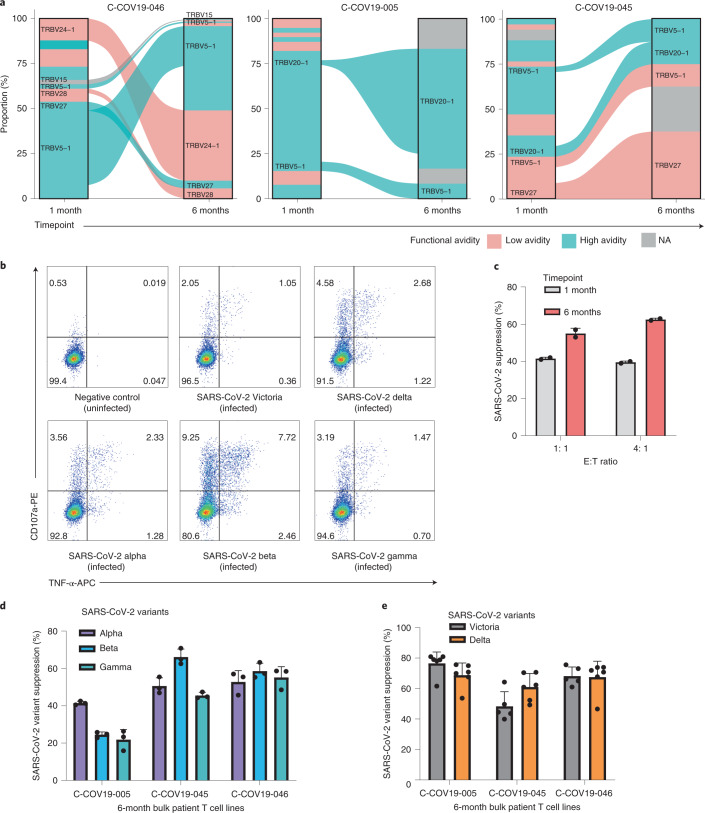
Fig. 7. Characterization of NP105–113-B*07:02-specific T cell responses at 6 months convalescence.
a, TCR repertoires of three patients at 1 month and 6 months convalescence. TRBV gene usage of common and expanded TCR clonotypes (defined as TRBV and TRBJ gene usage) are labeled for clarity. TCR clonotypes colored pink are low functional avidity and blue ones depict high functional avidity; clonotypes colored gray do not have similar TCRs to T cell clones. C-COV19-46 6-month cells were sequenced by 10× single-cell sequencing, and C-COV19-005 and C-C0V19-045 by bulk TCR sequencing. NA, not available. b, Representative ICS flow cytometry plots measuring TNF-α and CD107a expression on bulk NP105–113-specific T cell lines from C-COV19-046 incubated with SARS-CoV-2 Victoria, Alpha, Beta, Gamma or Delta variant-infected BCLs. c, Inhibition of SARS-CoV-2 viral replication (Victoria strain) by C-COV19-046 bulk NP105–113-specific T cell lines from 1-month (gray bars) and 6-month (red bars) convalescent samples (n = 2 biological replicates). Data are shown as mean ± s.d., representing three independent experiments with similar results. d, Antiviral activity of NP105–113-specific bulk T cells from 6 months convalescence against SARS-CoV-2 VOCs: Alpha (purple bars), Beta (blue bars) and Gamma (green bars) (n = 3 biological replicates). Data are shown as mean ± s.d., representing three independent experiments with similar results. e, Antiviral activity of NP105–113-specific bulk T cells from 6 months convalescence against SARS-CoV-2 VOCs: Victoria strain (gray bars) and Delta variant (orange bars) (n = 6 biological replicates). Data are shown as mean ± s.d., representing two independent experiments with similar results.

