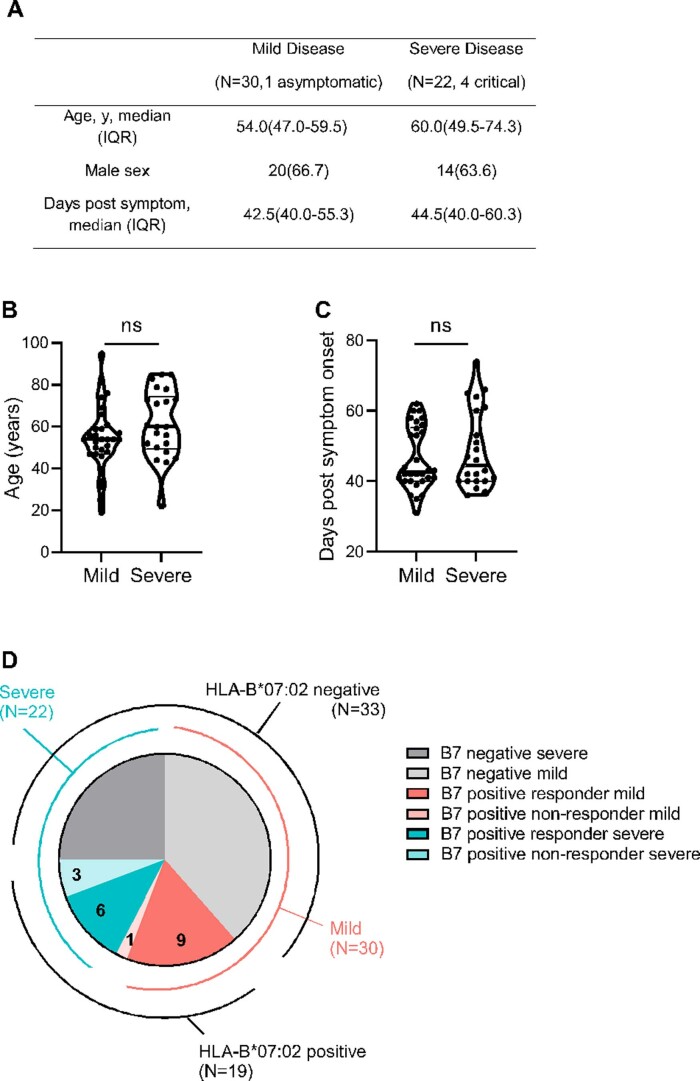
Extended Data Fig. 1. Patient characteristics.
(a) Distribution of age, gender and days post symptom onset when sampling of SARS-CoV-2 infected patients. (b) and (c) Comparison of age (ns, P = 0.116) and days post symptom (ns, P = 0.5711) when sampling between the patient groups with mild and severe symptoms. Unpaired t-test with Welch’s correction and Mann-Whitney test were used for data analysis of (B) and (C) respectively. Two tailed P value was calculated. (d) Breakdown of patient numbers and severity; HLA-B*07:02 negative (mild N = 20 light grey, N = 13 dark grey); HLA-B*07:02 positive responders (mild N = 9 red, severe N = 6 blue); HLA-B*07:02 positive non-responders (mild N = 1 light red, severe N = 3 light blue).

