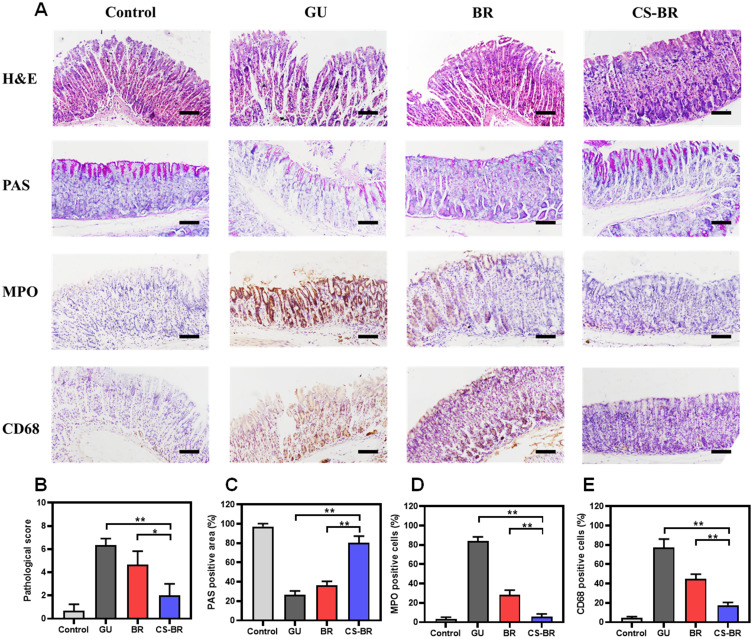
Figure 5.
The histological analysis of gastric tissue. (A) The images of hematoxylin and eosin (H&E) staining and periodic acid–Schiff (PAS) staining as well as the representative immunohistochemical images of myeloperoxidase (MPO) and CD68 in the gastric tissue of each group. Scale bar = 100 μm. (B) The pathological score in each group. (C) Quantitative analysis of the PAS-positive area. The quantitation of positive cells of (D) MPO and (E) CD68 in each group. Data are expressed as the mean ± standard deviation (SD) (n = 3). *P < 0.05, **P < 0.01.

