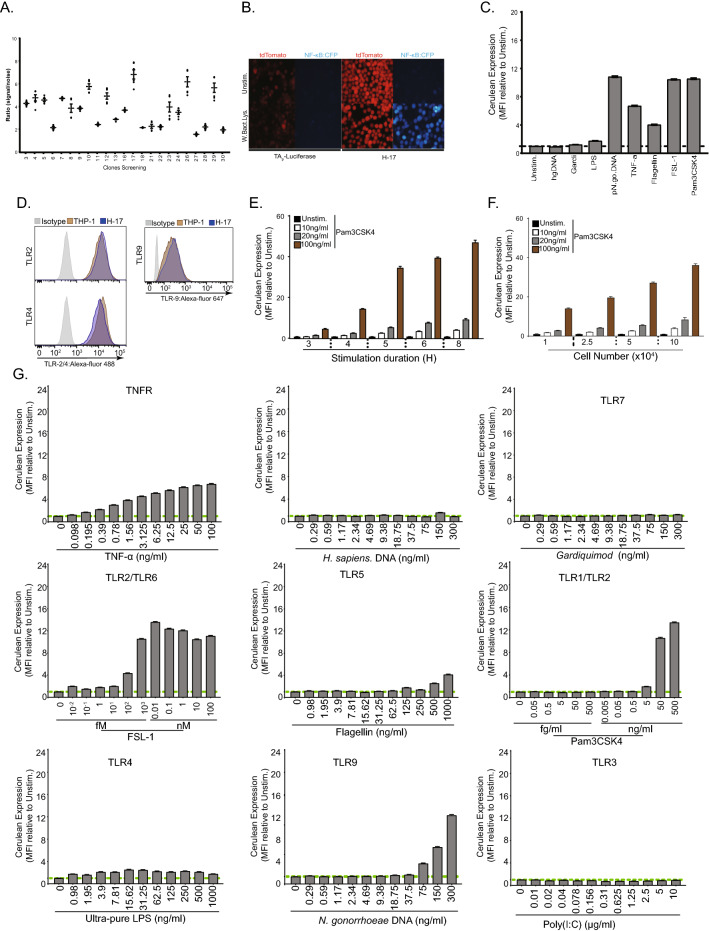
Figure 2.
Individual reporter cell clones show elevated responses to TLR agonists. (A) Signal to noise ratio response of individual reporter cell clones after stimulation with Pam3CSK4 (100 ng/ml) for 6 h. (B) Representative fluorescent microscopy images of H-17 expressing tdTomato (Red) and mCFP (Blue) stimulated as above. Scale bar = 10 µm. (C) Quantification of mCFP in H-17 cells in response to human genomic DNA, gardiquimod, LPS, piliated N. gonorrhoeae genomic DNA, TNF-⍺, B.subtilis Flagellin, FSL-1 and Pam3CSK4 compare to unstimulated cells. Bar graphs represent MFI ± SEM (n = 4). (D) Representative flow cytometry Dot plots for Toll like receptors (2, 4 and 9) from WT and H-17 and percentage of positive cells are indicated on each individual plots. Histograms are normalised to the mode. (E) Quantification of mCFP expression kinetic in H-17 upon stimulation of Pam3CSK4 after 3, 4, 5, 6 and 8 h. Bar graphs represent MFI ± SEM (n = 4). (F) Quantification of mCFP expression with different cell number 1, 2.5, 5 and 10 * 104 cells per well respectively. Bar graphs represent MFI ± SEM (n = 4). (G) Quantification of the H-17 limit of detection of specific TLR agonist TNF-α, H. sapiens genomic DNA, Gardiquimod, Poly(I:C), CpG ODN, FSL-1, Flagellin, Pam3CSK4 and N. gonorrhoeae genomic DNA respectively. Bar graphs represent MFI ± SEM (n = 3). See also Fig. S2.

