Figure 5.
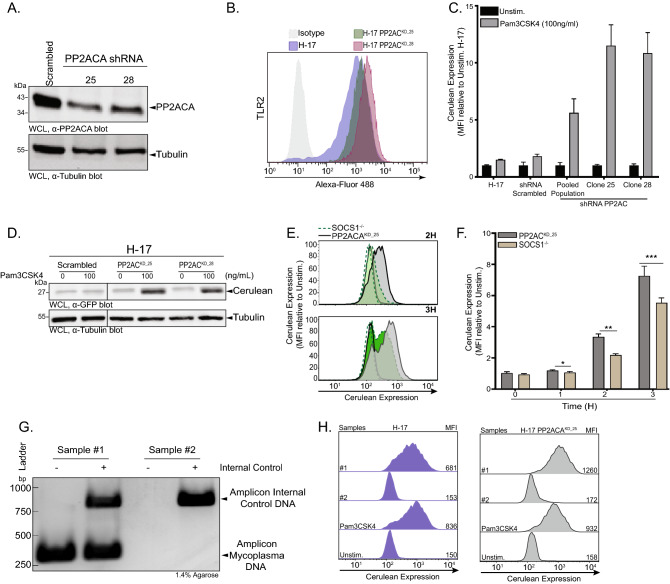
PP2ACA-knock-down H-17 cells are hypersensitive to bacterial lipoproteins and are useful for detecting mycoplasma contamination. (A) Western blots showing PP2ACA depletion in H-17 PP2ACAKD clones 25 and 28 compare to H-17 cells. See also Supplementary Fig. S5A for uncropped, full-size original Western Blot. (B) Representative flow cytometry histograms for TLR2 from H-17, H-17 PP2ACAKD_25 and H-17 PP2ACAKD_28 and percentage of positive cells are indicated on corresponding panels. Histograms are normalised to the mode. (C) Quantification of mCFP expression in H-17 PP2ACA knock-down compared to scrambled upon stimulation with Pam3CSK4 (100 ng/ml) for 6 h. Bar graphs represent MFI ± SEM (n = 4). (D) Western blots showing increasing expression of mCFP in H-17 PP2ACAKD_25, H-17 PP2ACAKD_25 compared to H-17 Scrambled after treatment with Pam3CSK4 (100 ng/ml) for 2 h. See also Supplementary Fig. S5B for uncropped, full-size original Western Blot. (E) Representative flow cytometry histograms of mCFP expression in H-17 PP2ACAKD_25 [grey, solid line] compared to H-17 SOCS1−/− [green, dashed line] after treatment for 2 h or 3 h with Pam3CSK4 (100 ng/ml). Histograms are normalised to the mode. Unfilled histograms represent unstimulated cells. (F) Quantification of mCFP expression in H-17 PP2ACAKD compared to H-17 SOCS1−/− after treatment for 1 h, 2 h or 3 h with Pam3CSK4 (100 ng/ml). Bar graphs represent MFI ± SEM (n = 4). (G) PCR analysis of a mycoplasma-positive (Sample #1) and a mycoplasma-negative (Sample #2) cell culture supernatant. See also Supplementary Fig. S5C for uncropped, full-size original agarose gel. (H) Representative flow cytometry histograms of mCFP expression in H-17 (left panels) or H-17 PP2ACAKD_25 cells (right panels) after 3 h of exposure to cell culture supernatants from (G). Incubation for 3 h with Pam3CSK4 (100 ng/ml) served as positive control. Histograms are normalised to the mode and the number indicates the mean fluorescent intensity (MFI).

