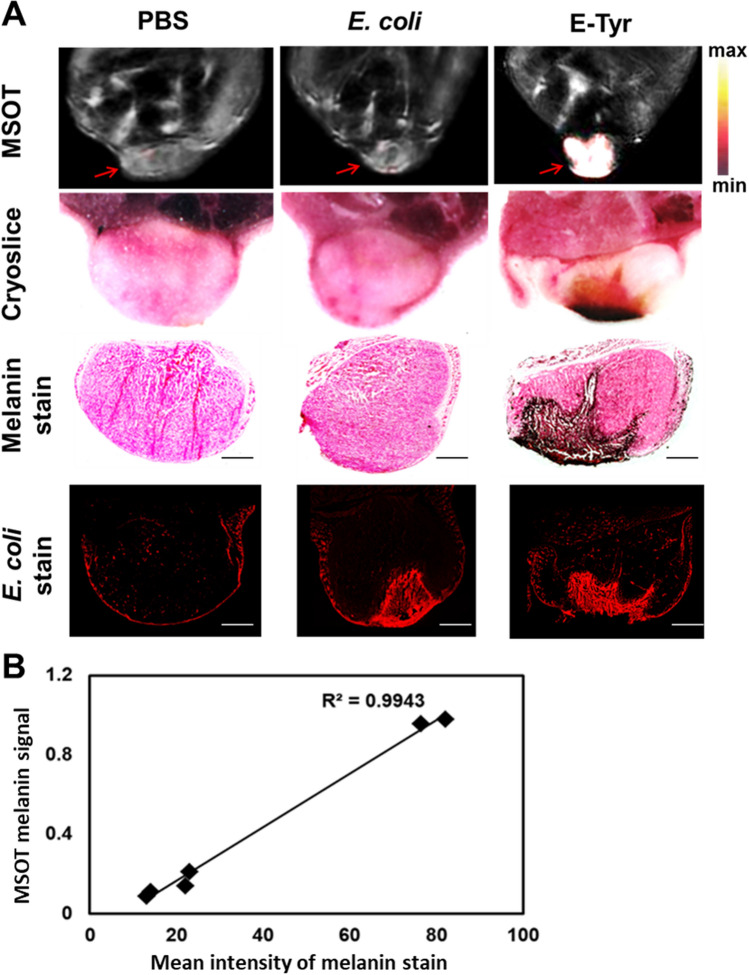
Figure 3.
Correlation between tumor optoacoustic melanin signal in vivo and the distribution of melanin in tumor cryo sections. (A) MSOT images of melanin signal using CT26 tumor-bearing live mice 24 h after E-Tyr injection (Top). Cyro-slice image of tumors. Tumors were assessed by specific melanin staining (darkbrown, middle) using the Fontana-Masson stain and E. coli stain (red fluorescence, bottom) with a specific E. coli antibody. High magnification (× 100) images of melanin and E. coli stains were obtained using the software ZENblue (CarlZeiss). (B) Correlation of the melanin signal of MSOT (24 h) and the mean intensity of melanin stain by the Pearson correlation method (R2 = 0.9943, n = 6).

