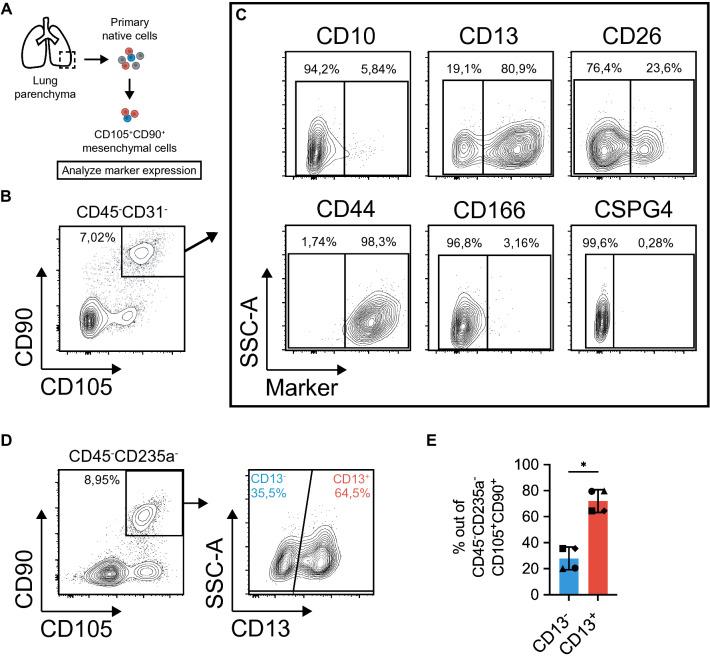
Figure 1.
Flow cytometry analysis of candidate mesenchymal markers identifies distinct CD105+CD90+ populations based on CD13 expression. (A) Schematic of experimental design for analysis of surface marker candidates in primary CD105+CD90+ mesenchymal cells from human lung parenchyma. (B) Multicolor flow cytometry analysis showing gating of CD105+CD90+ mesenchymal cells in freshly isolated cells. The plot is shown after forward-scatter/side-scatter gating, exclusion of dead cells (7AAD), hematopoietic cells (CD45) and endothelial cells (CD31), and doublet exclusion (area versus height in forward-scatter). (C) Plots show candidate marker expression (x-axis) versus side-scatter (y-axis) in CD90+CD105+ mesenchymal cells. For markers CD10, CD13, and CD26, gates are set to define separated population based on marker expression profile. For markers CD44, CD166 and CSPG4, gates are set based on fluorescence minus one (FMO) controls. (D) Plots demonstrate gating for identification of CD105+CD90+CD13− and CD105+CD90+CD13+ cells in cryopreserved primary/native cells from human lung parenchyma. The plots are shown after forward-scatter/side-scatter gating, exclusion of dead cells (7AAD), red blood cells (CD235a), and hematopoietic cells (CD45). Percentage of cells in each gate out of all cells in the plot, is indicated next to the gates. (E) Frequency of CD13− and CD13+ cells in CD105+CD90+ mesenchymal cell population from healthy parenchymal lung tissue (n = 4). Bars represent mean (with SD). Paired two-tailed t-test was used for statistical analysis of data (*p < 0.05). SSC-A side scatter-area.

