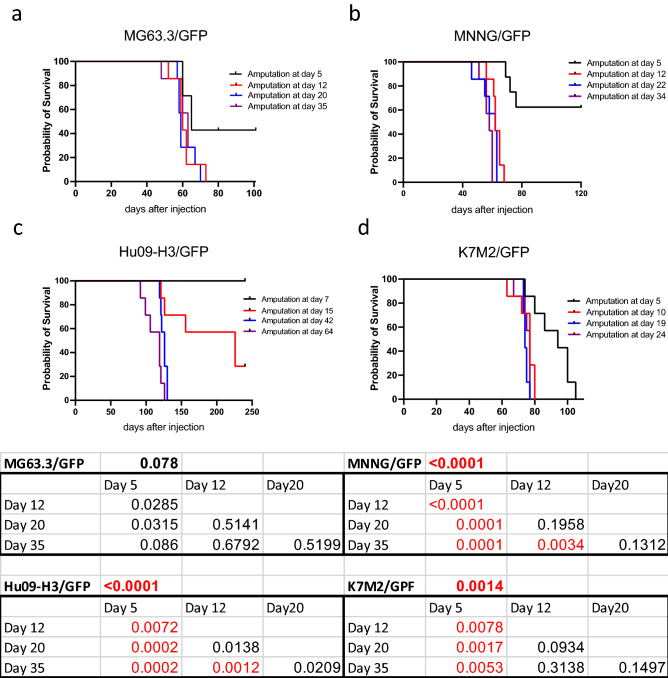
Figure 2.
Metastatic outcomes of NSG mice bearing OS cell line xenografts. (a–d) Kaplan–Meier survival curves for mice based on timing of amputation following injection of MG63.3 (a), MNNG (b), Hu09-H3 (c), K7M2 (d). (e) Mantel–Cox identified significant differences in the survival curves of mice bearing MNNG, Hu09-H3, and K7M2 xenografts. Comparisons by amputation time point are included in the underlying tables. For multiple comparisons between timepoints within each cell line, a Bonferroni-corrected threshold for significance of < 0.0083 was used.

