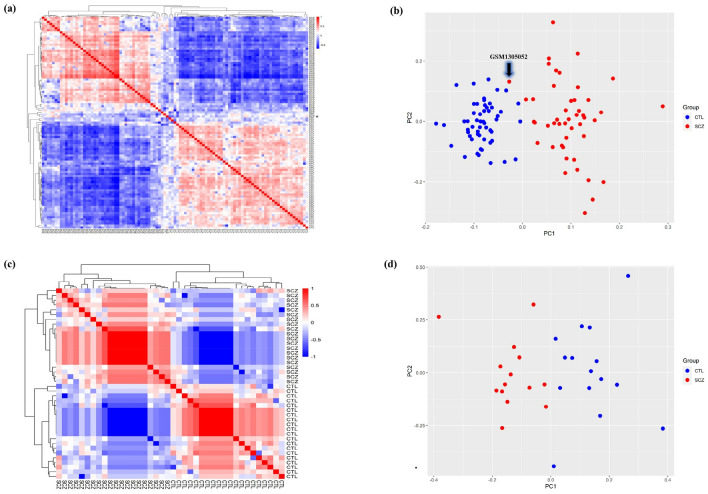
Figure 1.
Hierarchically clustered correlation heatmap and principal component analysis (PCA) for the brain dataset (GSE53987) are shown in (a) and (b), and for the lymphoblast dataset (GSE73129) are depicted in (c) and (d), respectively. Each column in the heatmap represents one sample and shows the correlation to all samples (including itself), with red for correlation = 1 and blue for the lowest observed correlation. All SCZ and CTL samples correlated well with each other, except one SCZ sample from the GSE53987 study marked by an asterisk (*). In PCA, all samples are segregated by condition group (on PC1). GSM1305052 (a patient striatum sample) was removed from further analysis in order to its wrong spatial enrichment. This figure was made using R version 4.0.3 (https://www.r-project.org/). CTL, control; SCZ, schizophrenia.

