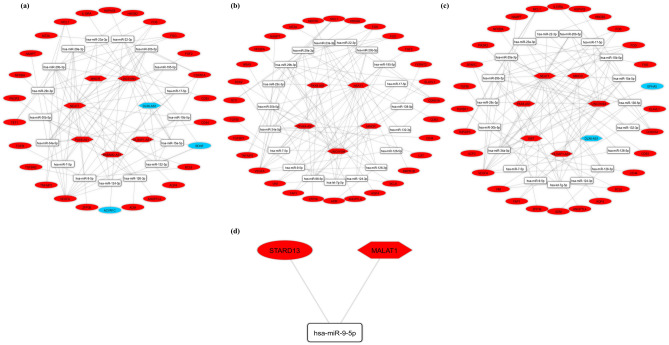
Figure 3.
The long non-coding RNA-associated competing endogenous RNA (ceRNA) network. ceRNA axes in (a) hippocampus, (b) Brodmann area 46, (c) striatum regions and (d) lymphoblasts. The red and blue nodes represent the upregulation and downregulation, respectively. Gray edges represent interactions between RNAs. This figure was generated using Cytoscape version 3.8.0 (https://cytoscape.org/)39. LncRNAs, miRNAs, and mRNAs are represented by hexagon, round rectangle, and ellipse, respectively.

