
Figure 2:
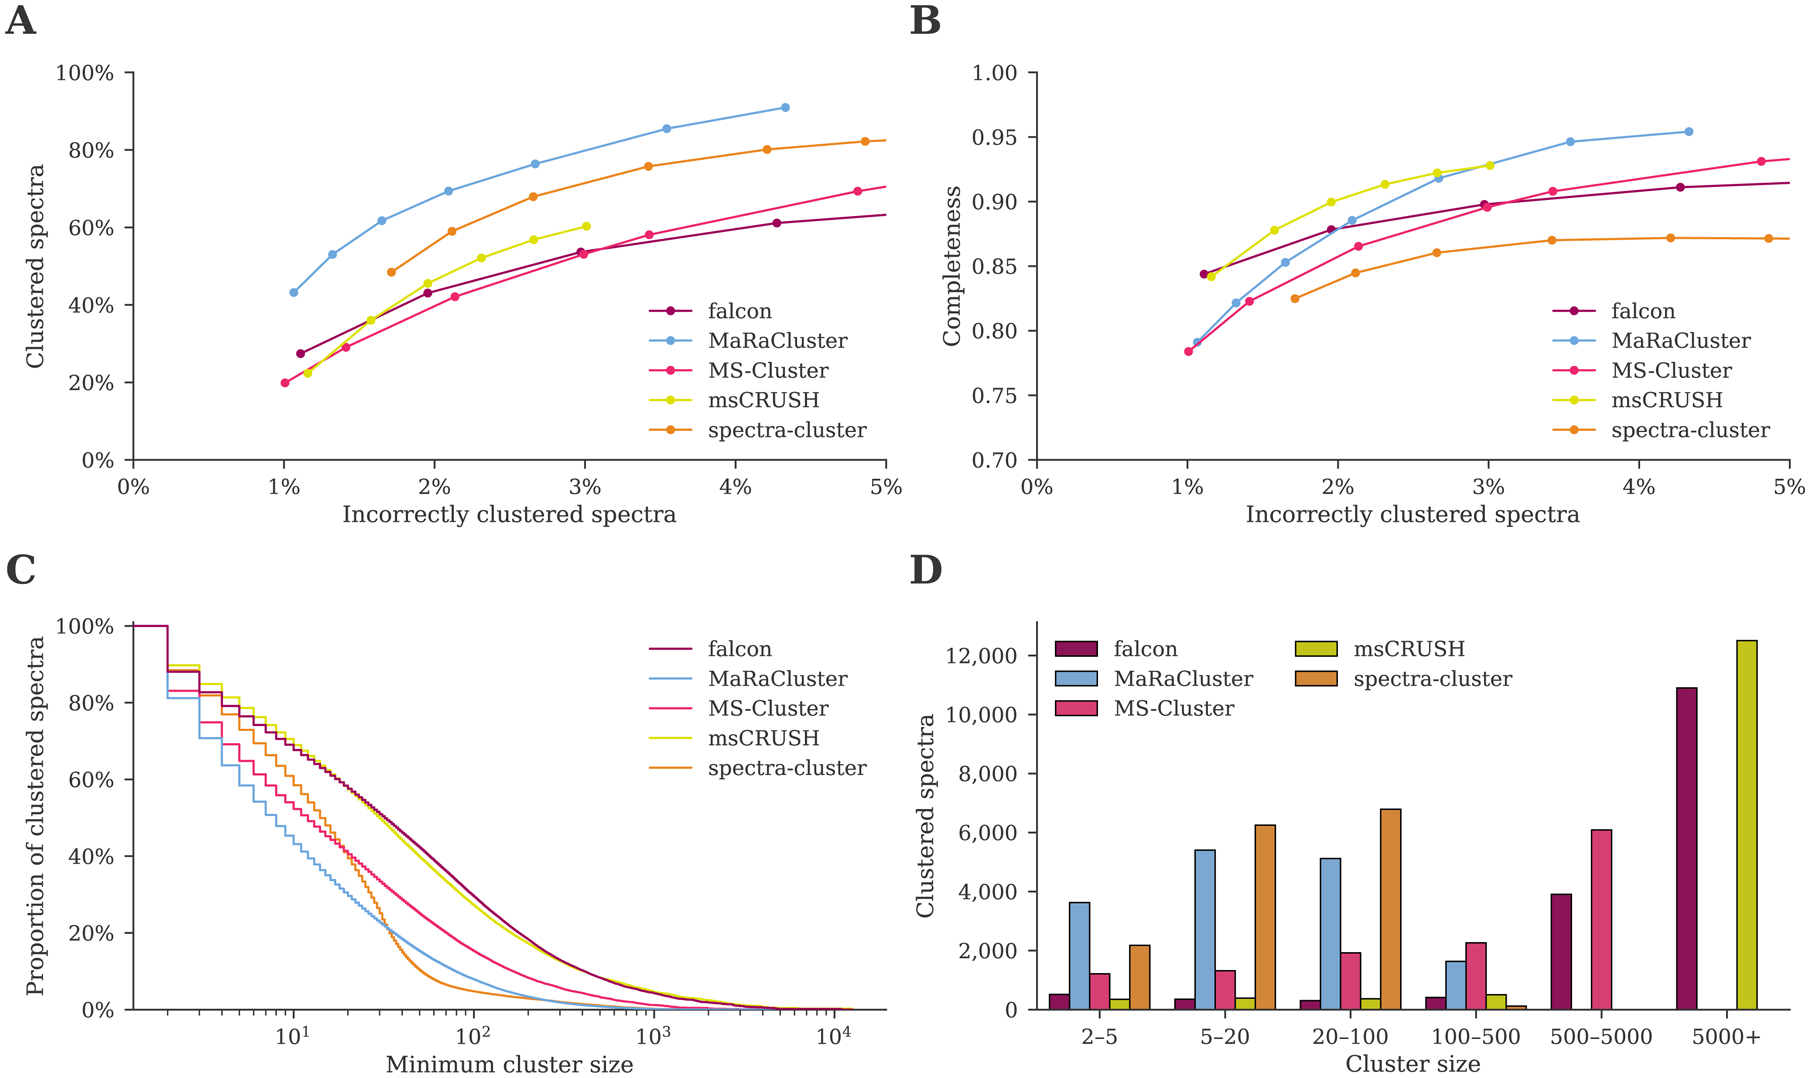
Clustering comparison between falcon, MaRaCluster, MS-Cluster, msCRUSH, and spectra-cluster. (A) MaRaCluster and spectra-cluster succeed in clustering more spectra than alternative tools at a comparable rate of incorrectly clustered spectra. (B) falcon, msCRUSH, and MaRaCluster produce a more complete clustering at different rates of incorrectly clustered spectra, grouping spectra corresponding to specific peptides in single clusters. (C) Complementary empirical cumulative distribution of the cluster sizes for the clustering results reported in table 1. Although MaRaCluster and spectra-cluster successfully cluster more spectra (less noise points), they predominantly generate clusters consisting of fewer than 100 spectra. In contrast, falcon and msCRUSH produce the largest clusters. (D) Cluster sizes for the frequently occurring peptide VATVSIPR/2. MaRaCluster and spectra-cluster split spectra corresponding to this peptide into a large number of small clusters consisting of less than 100 spectra each, whereas falcon and msCRUSH produce a few large clusters that contain thousands of spectra instead.