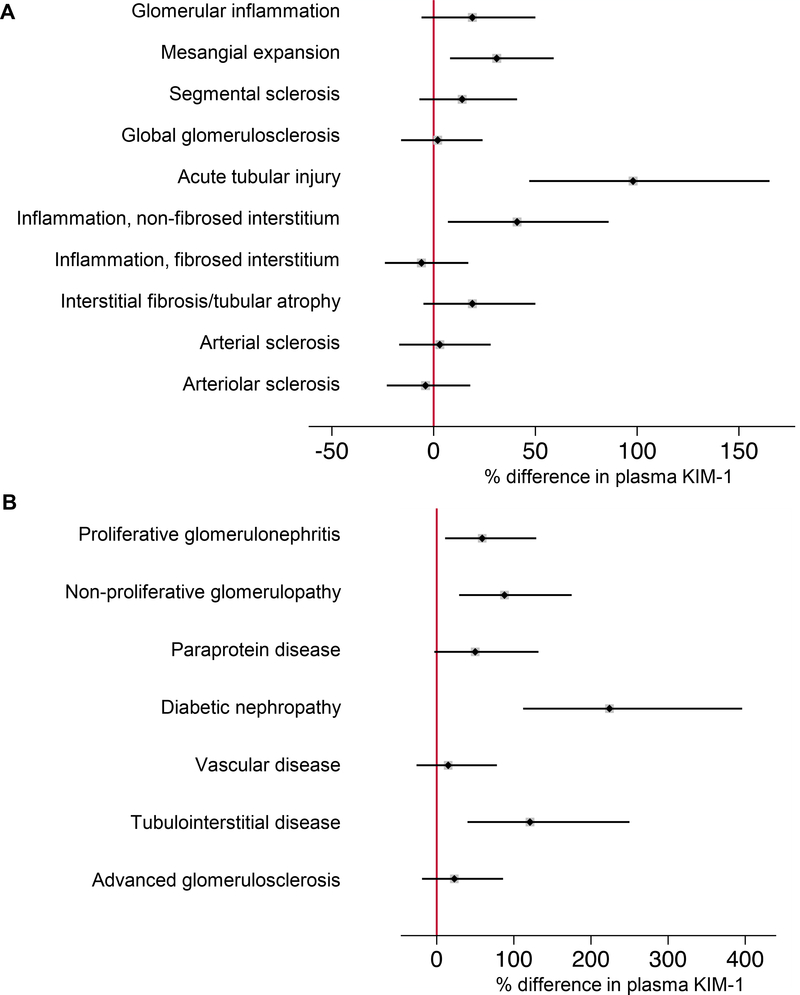
Figure 2. Adjusted differences in plasma KIM-1 by histopathologic lesion and clinicopathologic diagnosis.
Models were fit using log-transformed plasma KIM-1 as the outcome and histopathologic lesion (A) and clinicopathologic diagnosis (B) as the predictor variable. Percent differences are derived from linear regression models of log base 2 plasma KIM-1. Percent differences in plasma KIM-1 were calculated by raising 2 to the power of the beta-coefficient, subtracting 1, and multiplying by 100, [(2β – 1) * 100)], for each respective histopathologic lesion or clinicopathologic diagnosis from the linear regression model. Each individual model was adjusted for age, sex, race, and eGFR.
A. Reference is absence of lesion for glomerular inflammation (p=0.2), segmental sclerosis (p=0.2), inflammation in the non-fibrosed interstitium (p=0.01);
Reference is none/mild lesion severity for mesangial expansion (p=0.006), acute tubular injury (p<0.001), arterial sclerosis (p=0.8), arteriolar sclerosis (p=0.7);
Reference is 0-25% of cortical volume affected for global glomerulosclerosis (p=0.8), inflammation in the fibrosed interstitium (p=0.6), interstitial fibrosis/tubular atrophy (p=0.1).
B. Reference is near-normal tissue (comprised of individuals with minor abnormalities or relatively preserved parenchyma). Proliferative glomerulonephritis, p=0.01; non-proliferative glomerulopathy, p<0.001; paraprotein disease, p=0.07; diabetic nephropathy, p<0.001; vascular disease, p=0.5; tubulointerstitial disease, p<0.001; advanced glomerulosclerosis, p=0.3.

