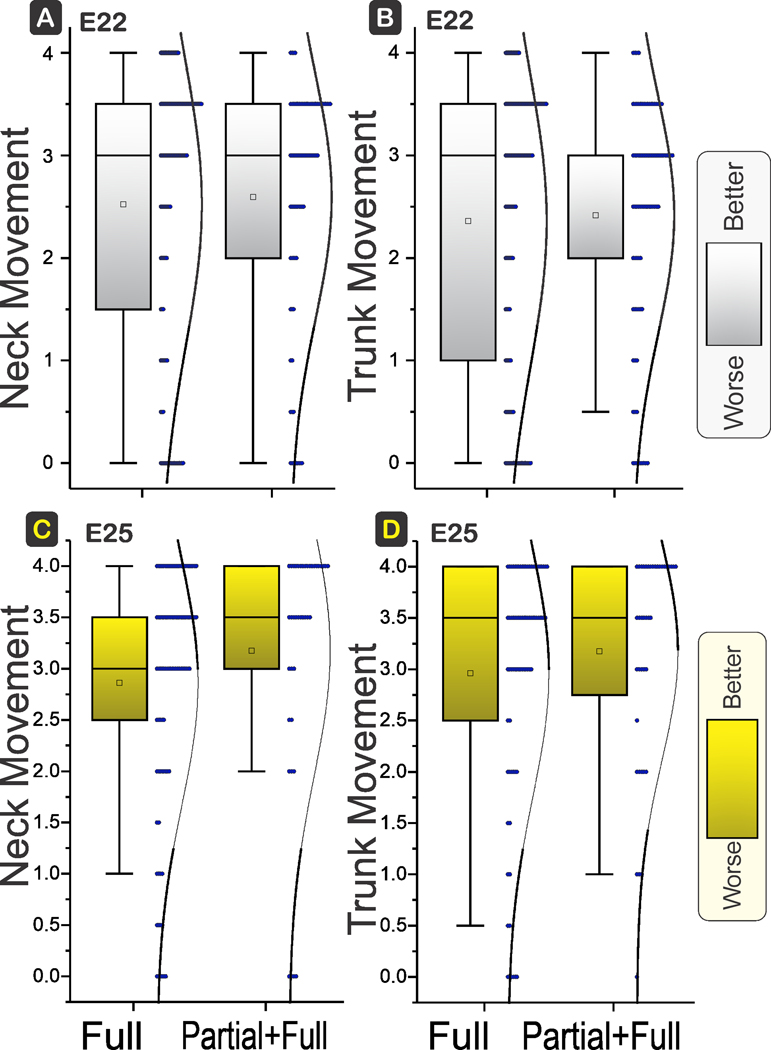
Figure 6. Neck and Trunk Movement.

Box and whisker plots with distribution depicted. E22 H-I in top row and E25 H-I in bottom row. There were no differences between the neck (A, C) and trunk movements (B, D) between Full and Partial+Full H-I groups at E22 (power 12%, 9%; P=0.6657, 0.7385) or E25 (power 46%, 17%; P=0.1672, 0.3479). Shading to show which direction is worse.
