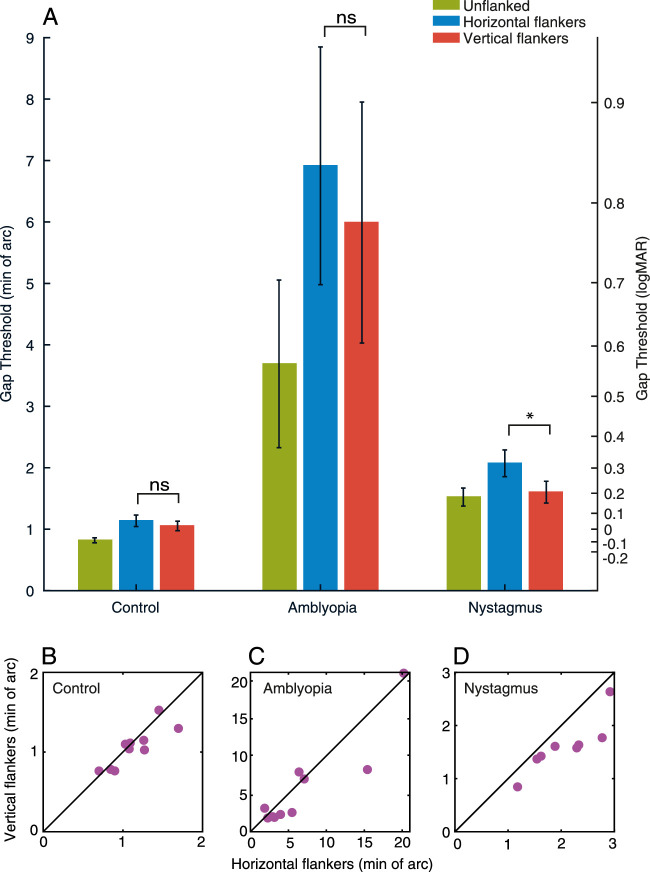
Figure 3.
(A) Gap thresholds for all participant groups, plotted in minutes of arc (left y-axis), with comparison to their logMAR equivalents (right y-axis). The blue bars plot thresholds for the unflanked condition, green bars the horizontal flanker condition and red bars the vertical flanker condition. Error bars represent the SEM, with *= significant and ns = not significant. (B–D) Gap thresholds (in min. of arc) with horizontal flankers for each individual plotted on the x-axis, against gap thresholds with vertical flankers on the y-axis. The black line represents perfect correspondence between gap thresholds with horizontal and vertical flankers. Purple circles represent individual participants. Note the variation in X and Y scales.

