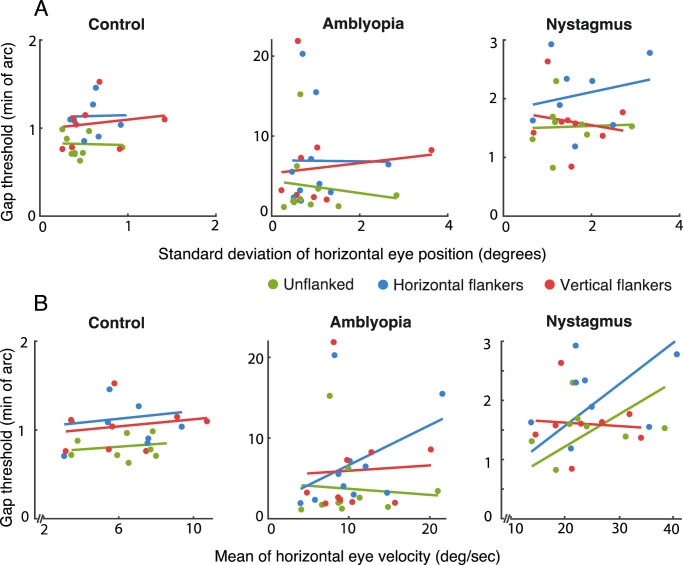
Figure 8.
(A) Gap thresholds plotted against the standard deviation of the horizontal eye position for each of the stimulus conditions and for each individual in the three participant groups (separate panels). (B) Gap thresholds plotted against the mean of the eye velocity in the horizontal plane. Colored circles separate the data into the three stimulus conditions (unflanked, horizontal, and vertical flankers). Colored lines represent the best fit linear function of the corresponding-colored data. Note the individual x and y axis scales for each participant group.

