Fig. 2.
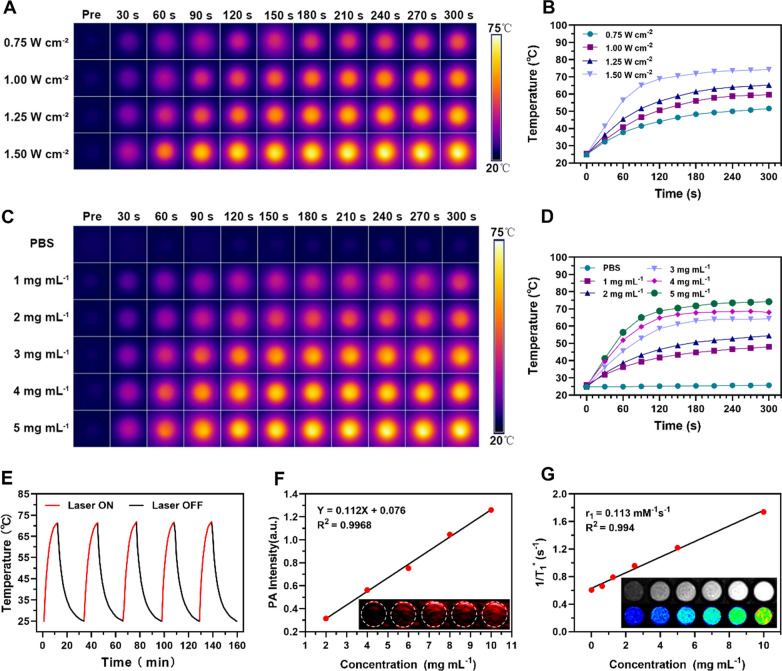
A Infrared thermal images of M@P-PDR at a concentration of 5 mg mL−1 under 808 nm laser irradiation at different power densities (0.75, 1.00, 1.25 and 1.50 W cm−2), and B the corresponding temperature–time curves of M@P-PDR at different power densities. C Infrared thermal images of M@P-PDR at different concentrations (0, 1, 2, 3, 4 and 5 mg mL−1) under 808 nm laser (1.5 W cm˗2, 5 min) irradiation, and D the corresponding photothermal temperature–time curves of M@P-PDRs at different concentrations. E Temperature change curves of M@P-PDR over five laser irradiation on/off cycles. F Linear relationship between PA intensities and M@P-PDR concentrations, and the corresponding in vitro PA images (inset). G T1 relaxation rate of M@P-PDR and the corresponding in vitro MR images (inset)

