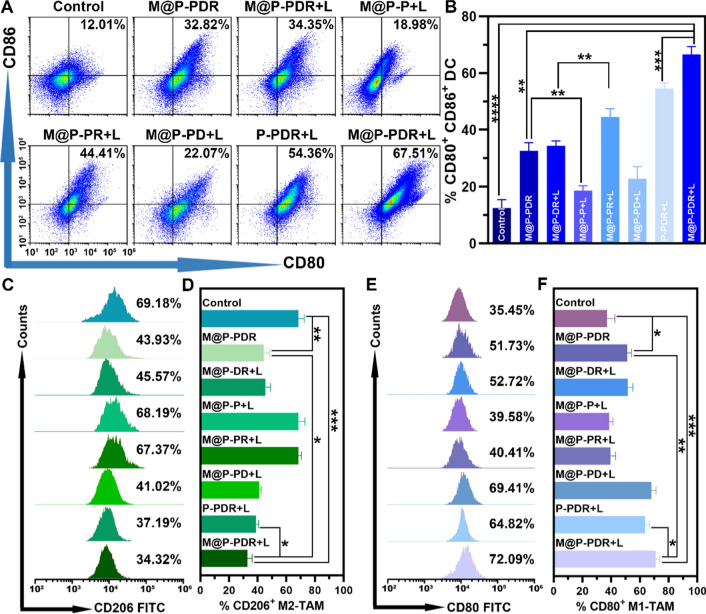
Fig. 8.
Degree of in vivo DCs maturation and polarization of TAMs based on M@P-PDR “Nano-targeted cells”. A Flow cytometric analysis of DCs maturation in primary tumors (1st) of mice in different treatment groups. and B the corresponding quantification of DCs maturation (n = 3). C Flow cytometric analysis of M2-TAMs (CD206+ F4/80+ CD11b+) in primary tumors (1st) and D the corresponding quantification of M2-TAMs (n = 3). E Flow cytometric analysis of M1-TAMs (CD80+ F4/80+ CD11b+) in primary tumors (1st) and F the corresponding quantification of M1-TAMs (n = 3, t-test, *p < 0.05, **p < 0.01, ***p < 0.001, ****p < 0.0001)

