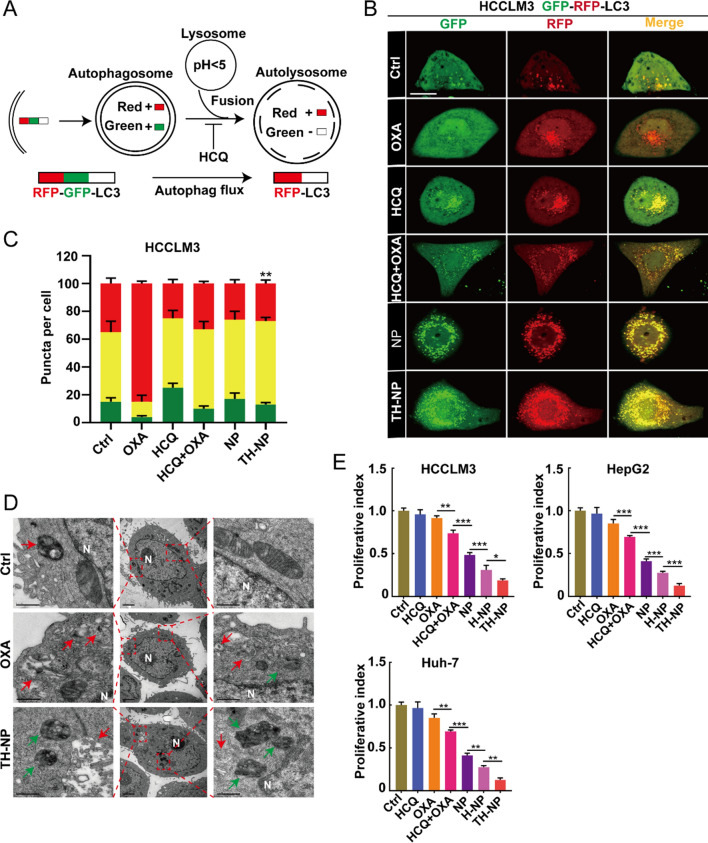
Fig. 2.
TH-NPs demonstrated targeted inhibition of the protective autophagy and significantly enhanced chemotherapy in vitro. A GFP-RFP-LC3 dual reporter assay to analyze the blockade of autophagy flux. B The abundance of RFP-LC3 puncta was significantly enhanced over GFP puncta in OXA-treated cells, illustrating OXA triggered protective autophagy indicated by the accumulation of autolysosomes. HCQ can inhibit the autophagy flux or autophagosome–lysosome fusion (Free OXA = 20 μM, HCQ = 10 μM, the equivalent concentration of OXA or HCQ in NPs or TH-NPs). Scale bar: 10 μm. C Quantification analysis of the autophagy flux of HCCLM3 after the indicated treatments. Eight random fields (n = 8) were used for quantificationally analyzing the intracellular level of autophagosomes (GFP and RFP puncta) and autolysosomes (RFP-only puncta). D Representative TEM images of intracellular level of autophagic vacuoles in HCCLM3 cells (N, nucleus; red arrow, autolysosomes; green arrow, autophagosomes). E Quantification of the proliferation index of HCCLM3, HepG2 and Huh-7 cells according to the crystal violet staining after the indicted treatments. Data were displayed as the mean ± SD. *P < 0.05; **P < 0.01; ***P < 0.001

