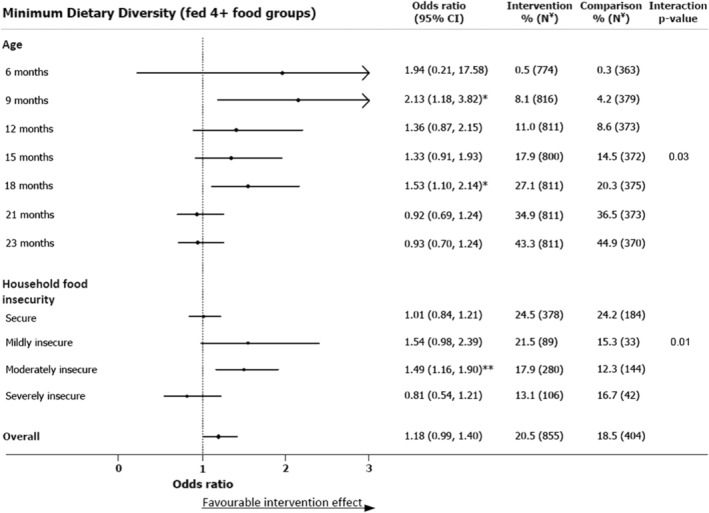
Figure 3.

Effect of nutrition counselling using a digital job aid on minimum dietary diversity at different follow‐up visits between children 6 and 23 months of age and by household food security. *p‐value < 0.05, **p‐value < 0.01 indicate that the intervention effect is significant; interaction p‐value tests the null hypothesis that the effect of intervention is the same across all subgroups; Ψ Ns in household food insecurity subgroups represent number of children had feeding practice data for at least one follow‐up visit
