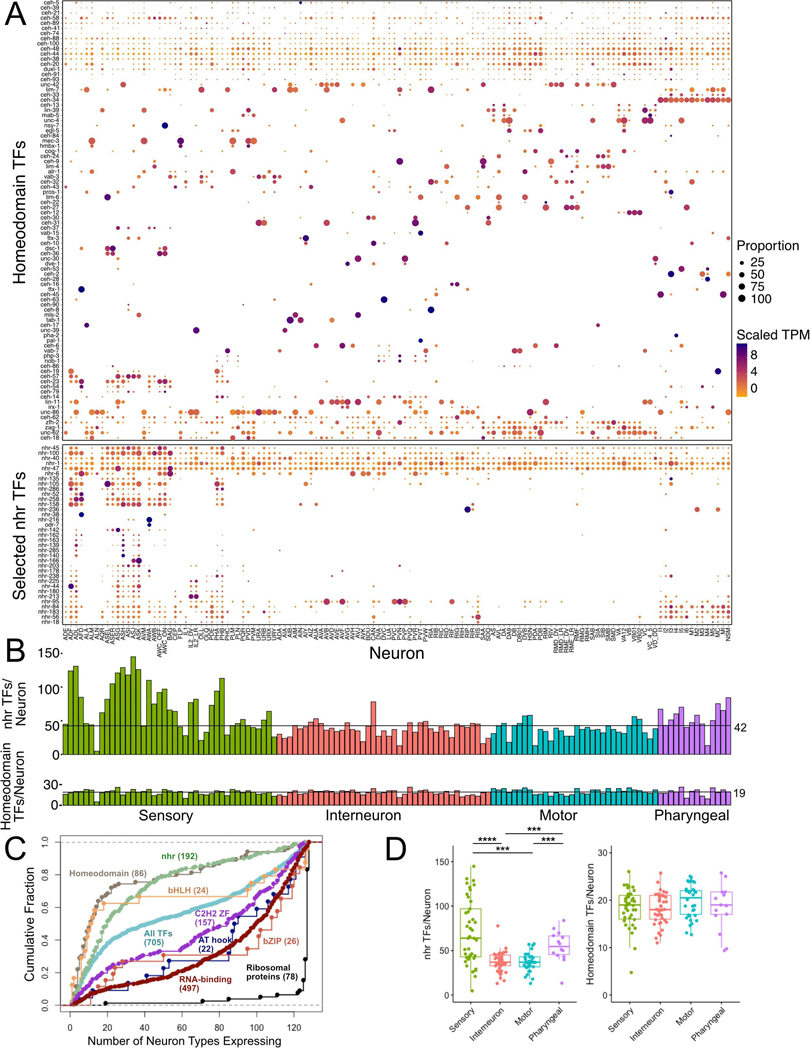
Figure 4. Expression of transcription factor families.
A) Heatmap of homeodomain and representative subset of nuclear hormone receptor (nhr) transcription factors (TFs) across 128 neuron types (columns) grouped by neuron modality. TFs are clustered for each subfamily. Circle diameter represents the proportion of neurons in each cluster that expresses a given gene. B) Bar graphs of number of nhr and Homeodomain TFs in each neuron type, grouped by neuron modality. C) Cumulative distribution of number of neuron types expressing Homeodomain, bHLH, nhr, C2H2 ZF (Zinc Finger), AT hook, bZIP transcription factor (TF) families, RNA binding proteins and ribosomal proteins (see also Figure 3A). D) Quantitative comparison of TFs per neuron for nhr (left) and Homeodomain TFs (right) shows enrichment in sensory neurons for nhrs, but no differences for Homeodomains. Boxplots are median and interquartile range (25th – 75th percentile), Kruskal-Wallis. ***p < 0.001, ****p < 0.0001. See also Data S1.

