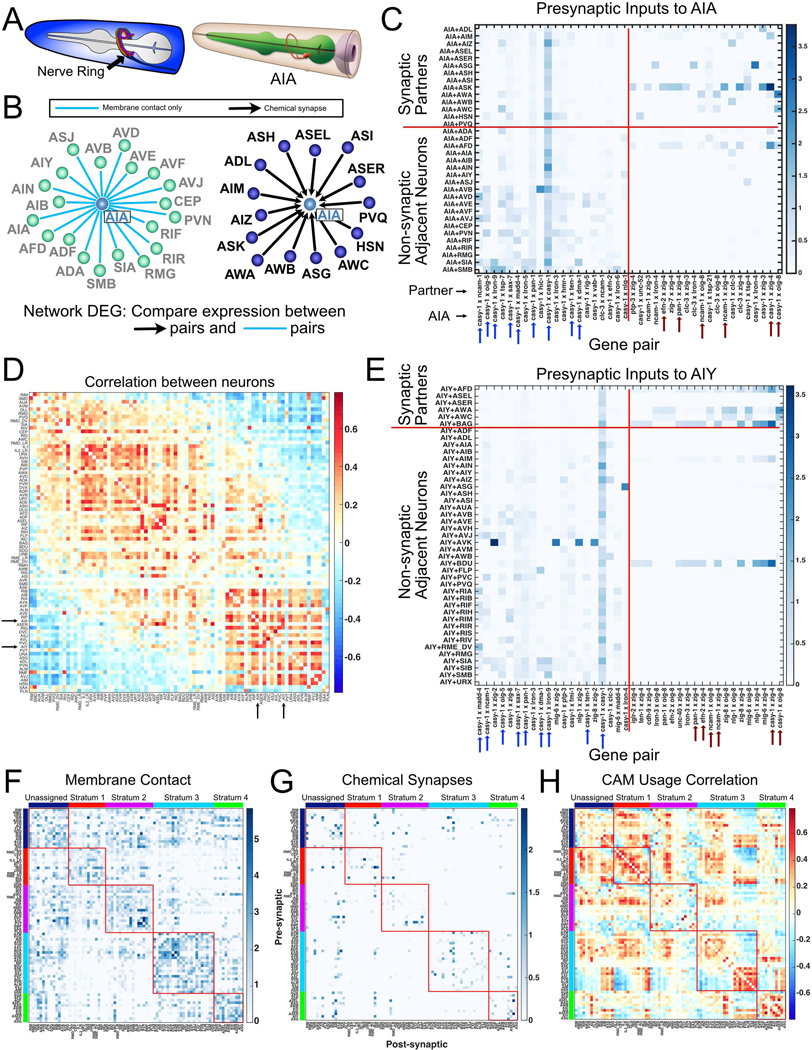
Figure 7. Differential expression of cell adhesion molecules among neurons and their presynaptic partners.
A) (Left) The C. elegans nerve ring. (Right) AIA ring interneuron. From WormAtlas. B) Neurons with presynaptic input to AIA (right) and neurons with membrane contact but no synapses with AIA (left). C) Heatmap of 20 cell adhesion molecule (CAM) gene pairs with highest log fold change in AIA + presynaptic inputs vs AIA + non-synaptic adjacent neurons (right of vertical red line). 20 CAM gene pairs with highest log fold change in AIA + non-synaptic adjacent neurons vs AIA + presynaptic partners (left of vertical red line). Arrows denote gene pairs common for AIA and AIY (panel E). D) Correlation matrix for CAM usage (see text) across all neurons in the nerve ring (84 neuron types). Arrows indicate AIA and AIY (correlation = 0.568). E) Heatmap as in C, for AIY. Arrows denote gene pairs common for AIA and AIY. F) Membrane adjacency matrix was grouped by nerve ring strata (each outlined with red box) (Moyle et al., 2021). Within each stratum, neurons were ordered according to CAM usage correlations (see panel H). G) Strata ordering as in F was imposed upon the chemical connectome revealing that most synapses are detected between neurons within the same stratum. H) The CAM usage correlation matrix (as in D) was grouped by strata, then sorted by similarity within each stratum. CAM usage is broadly shared for neurons in strata 1 and 4. Stratum 3 shows two distinct populations. See also Methods S1.

