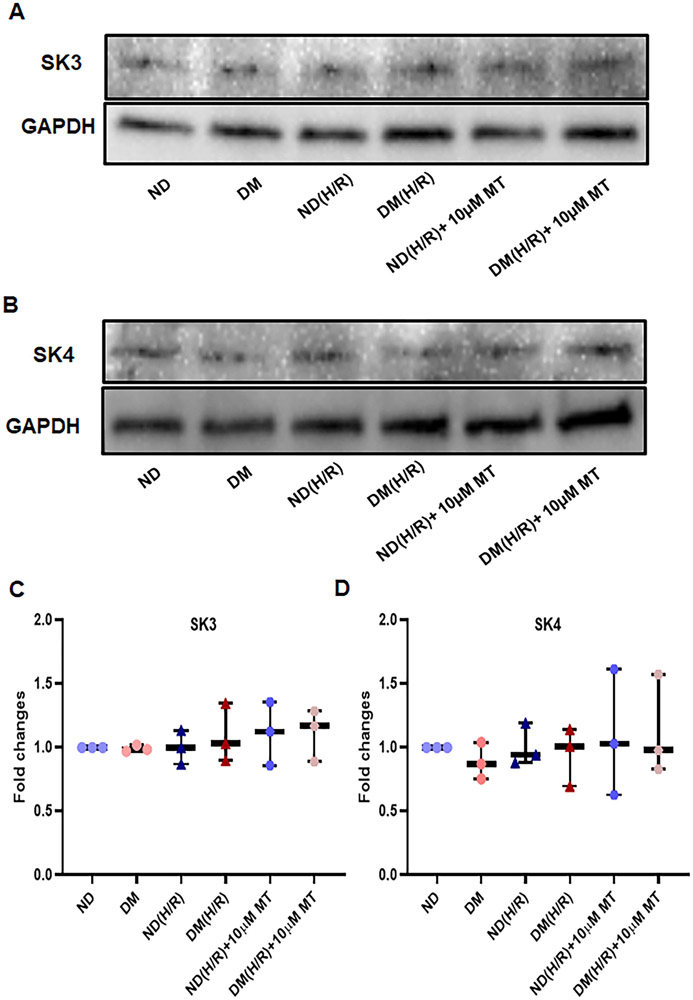
Figure 5. H/R and MT treatment failed to effect SK3 and SK4 protein expression in the mouse heart endothelial cells (MHECs).
A and B, Immunoblot intensity of small conductance calcium activated potassium channels (SK), SK3 (A), SK4 (B) with a GAPDH loading control, C and D, graphs showing densitometric analysis of immunoband intensity of SK3 (C) and SK4(D) protein expression in the experimental groups. ND = non-diabetes, DM- diabetes; ND (H/R) = ND cells treated by hypoxia/re-oxygenation; DM (H/R) = DM cells treated by hypoxia/re-oxygenation; ND (H/R) + 10μM MT = ND(H/R) cells treated with 10μM mito-Tempo; DM (H/R) + 10 μM MT = DM (H/R) cells treated with 10μM mito-Tempo; n =3/group. Mean ± SD, One-way ANOVA and a post hoc Bonferroni test.

