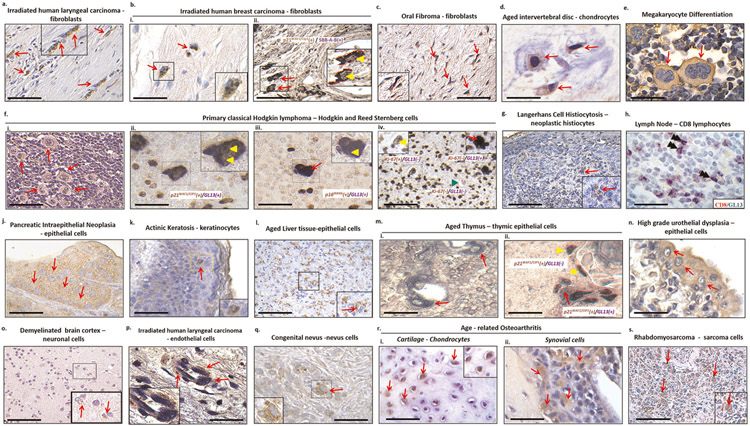
Extended Data Fig. 3 ∣. Sensitive detection of senescence using GL13 in a variety of tissues from human clinical samples.
Senescent cells of different cell origin (mesenchymal: a-d, p, r, s; megakaryocytes: e; lymphoid/histiocytic: f-h; epithelial: j-n; neuronal:o, nevoid:q) identified via GL13 staining in various clinical settings (red arrows and double black arrowheads in image h). Chromogenic assays: DAB-brown cytoplasmic signal (a, bi, c-g, j, k, l, n-s) and Alkaline phosphatase (BCIP/NBT)-blue purple cytoplasmic signal (bii, fii-iv, h, m); Double staining experiments showing nuclear p16INK4A or p21WAF1/Cip1 expression (yellow arrowheads) in senescent cells that are simultaneously positive with GL13 (red arrows) (bi, fii-iii, mii). Mutually exclusive staining pattern between nuclear Ki67 positivity (yellow arrowhead) and GL13 reactivity (red arrows) is evident (fiv). Green arrowhead depicts a double negative cell (fiv). Images adopted from: b, q28; f, g, j69; h70; k71; m72; o73; s74. Counterstain: Hematoxylin for DAB and Nuclear Fast Red for BCIP/NBT. Scale bars: 25 μm (e, p), 50μm (bii, d, f, h, m, n, q, r), 100μm (a, bi, g, j, k, o) and 200 μm (c, l, s).

