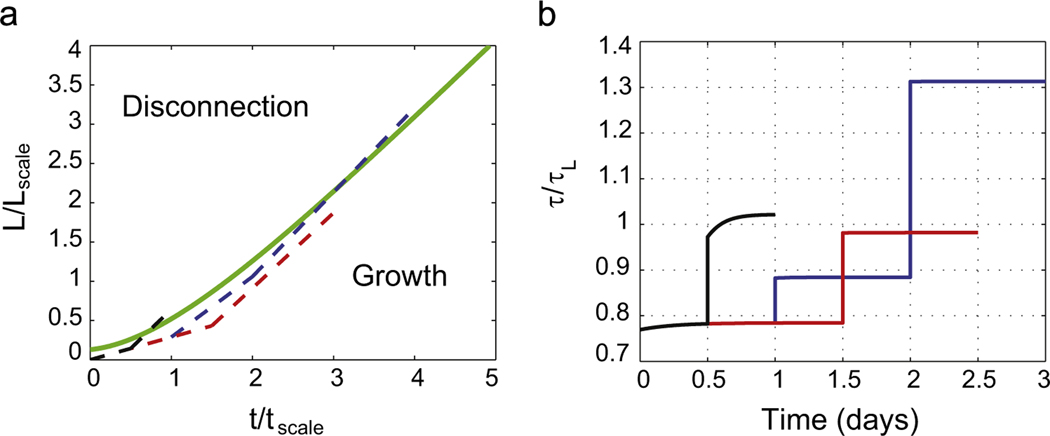
Fig. 5.
(a) The green line shows the limiting L(t) curve for = 5.7, = 5.2 and l(0) = 0.13. The blue dashed line has the following trajectory for day 1 for day 2 and for days 3 and 4. The red dashed line has the following trajectory for day 1 and 12 h on day 2, , thereafter. The black dashed line has the following trajectory for 12 h, thereafter. The evolution of the tension τ is plotted on the right. (b) The tension crosses τL for the blue and black curves, but not for the red curve. Therefore, the blue and black protocols lead to disconnection, but the red protocol does not. Note also that in the black protocol we could exceed for several hours without causing disconnection because it takes time for the tension to reach the failure value. We have mimicked the experiments shown in Fig. 4A of Smith (2009).

