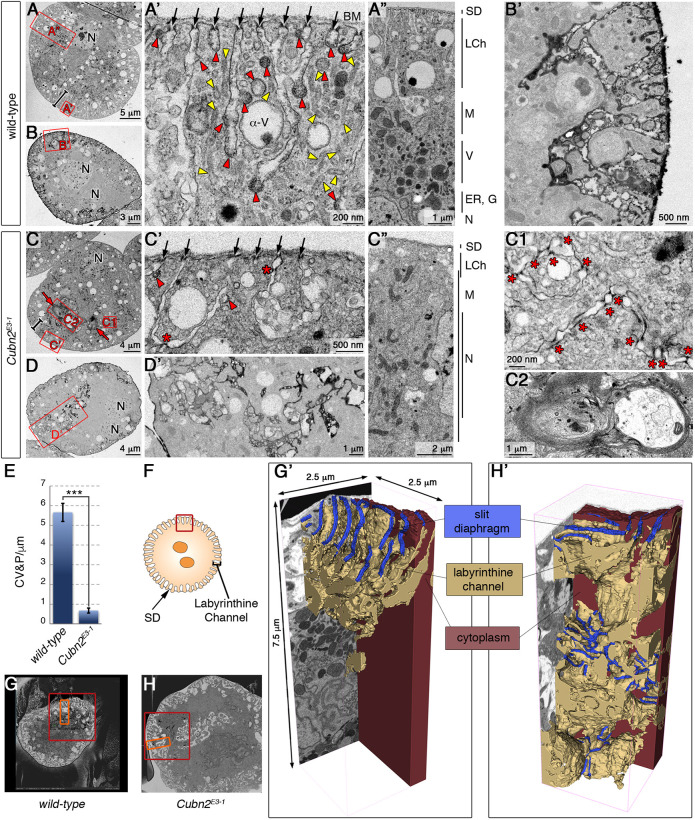
Fig. 2.
Ultrastructural analysis of Cubn2E3-1 nephrocytes. (A-D′) TEM images from medial sections of larval nephrocytes. Bars in A and C indicate the depth of the subcortical zone and red squares indicate the regions enlarged in adjacent panels. (A-A″) Images showing the length of the channels sealed by SDs (arrows), the profusion of clathrin-coated vesicles/pits and tubules (red and yellow arrowheads, respectively), and the characteristic zonation of wild-type cells (A″) (n=10). (B,B′) Tannic acid impregnation in wild-type nephrocytes (n=3). (C-C2) Cubn2E3-1 nephrocytes display a shortening of the LCh layer (bars, C,C″ with details in C′), scant clathrin-coated structures (arrowheads), reduced SD density at the cortex (black arrows in C′), ectopic SDs in internal regions (stars in C′,C1) and the presence of multilaminar structures (C, red arrows and C2) (n=11). (D,D′) A tannic acid-impregnated Cubn2E3-1 nephrocyte revealing the continuity of the membrane ingressions with the extracellular space (n=8). (E) Quantification of clathrin-coated structures in wild-type and Cubn2E3-1 nephrocytes (n=60 and 100 micrographs, data are mean±s.e.m.; P<0.05). (F) Scheme of the region used for FIB-SEM analysis. (G,H) Low-magnification images of wild-type (G) and Cubn2E3-1 (H) nephrocytes selected for FIB-SEM acquisition; red squares show regions processed by FIB-SEM and orange rectangles show those used for segmentation. (G′,H′) 3D models of LCh and SD distribution in wild-type (G′) and Cubn2E3-1 (H′) nephrocytes. The LCh model was partially sectioned to allow visualisation of internal regions. SDs cover 35% of the nephrocyte surface in the wild type and 16% in Cubn2E3-1. BM, basement membrane; M, mitochondria; V, vacuole; G, golgi; N, nucleus; LCh, labyrinthine channel; SD, slit diaphragm.

