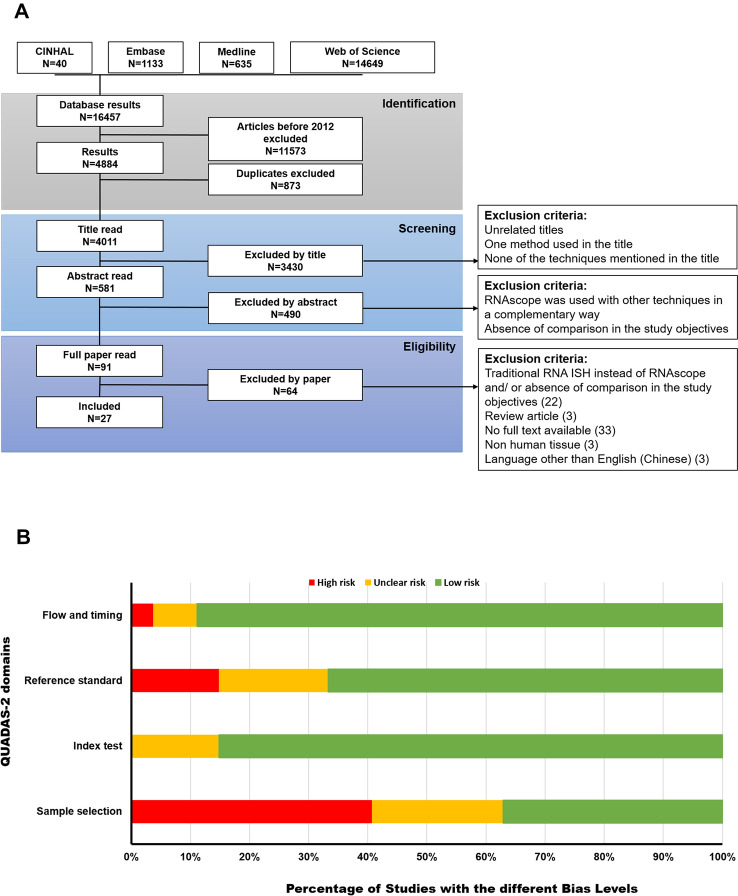
Fig. 2.
PRISMA flow diagram and assessment of risk of bias. A The presented flow-chart outlines and summarizes the main research steps that were taken in the sequential selection of the articles included in the systematic review, including an explanation of the exclusion criteria for each step.
Adapted from PRISMA [32]. B The presented bar-chart illustrates the percentage of studies for each RoB level within each domain for the included studies as determined using QUADAS-2 tool. Green represents a low risk, yellow represents an unclear risk, and red represents a high risk

