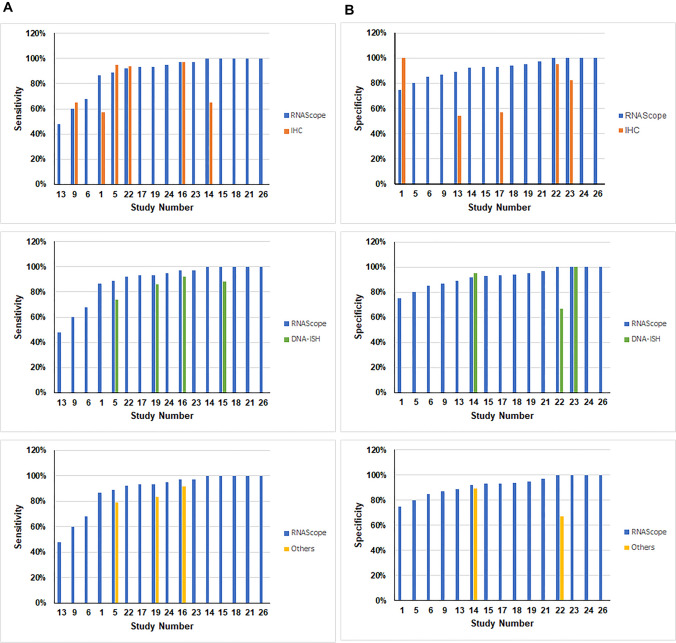
Fig. 5.
The sensitivity and specificity ratios of RNAscope versus other techniques. The presented bar charts illustrate: A sensitivity ratios for RNAscope (13 studies) and other techniques whose values were co-reported in the same studies. Top graph—IHC (co-reported in six studies); middle graph—DNA ISH (co-reported in four studies); lower graph—DNA PCR (co-reported in three studies) and B specificity ratios for RNAscope (11 studies) and other techniques whose values were co-reported in the same studies. Top graph—IHC (co-reported in five studies); middle graph—DNA ISH (co-reported in two studies); lower graph—DNA PCR (co-reported in two studies)

