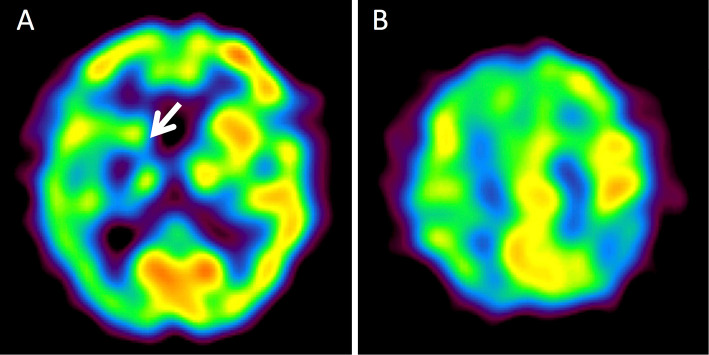
Figure 2.
Single-photon emission computed tomography images. A, B: Single-photon emission computed tomography using technetium-99m ethylcysteinate dimer on day 29 after the onset of hemichorea demonstrates hypoperfusion in the territory of the right middle cerebral artery, predominantly in the right basal ganglia (arrow).

