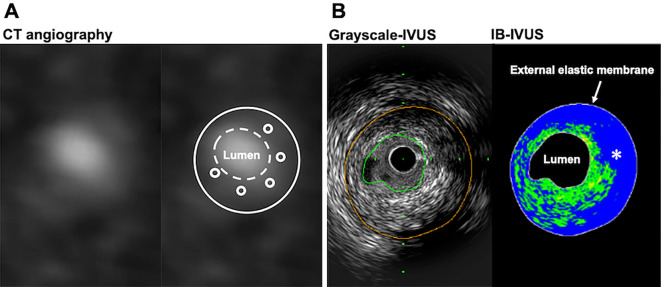
Figure 1.
Example of plaque assessments performed by CT angiography and IVUS. A: Cross-sectional image of CT angiography (left panel) using the diluted-contrast injection protocol. Average plaque CT attenuation was calculated with five intra-plaque ROIs (right panel). B: Grayscale IVUS image (left panel) and IB-IVUS image (right panel) corresponding to the CT section. The blue color (asterisk) indicates the large lipid pool, and the green color indicates the fibrous area on IB-IVUS. CT: computed tomography, HU: Hounsfield units, IB: integrated backscatter, IVUS: intravascular ultrasound, ROI: region of interest

