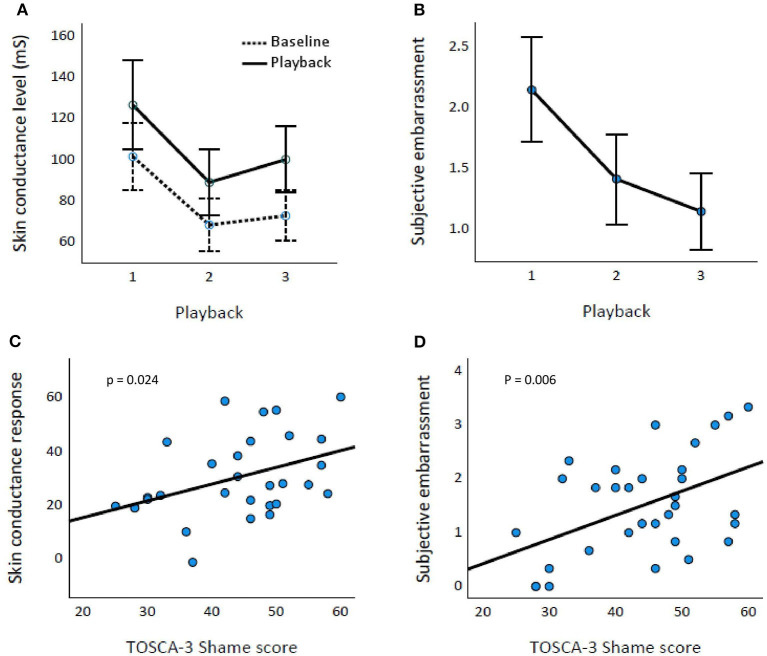
Figure 2.
Affective response and TOSCA-3Shame scores. Baseline and playback skin conductance levels (A) and subjective embarrassment (B) across Playbacks 1–3. Error bars represent 95% CIs. TOSCA-3Shame score is associated with both skin conductance response (percentual increase; p = 0.024) (C) and subjective embarrassment (p = 0.006) (D).

