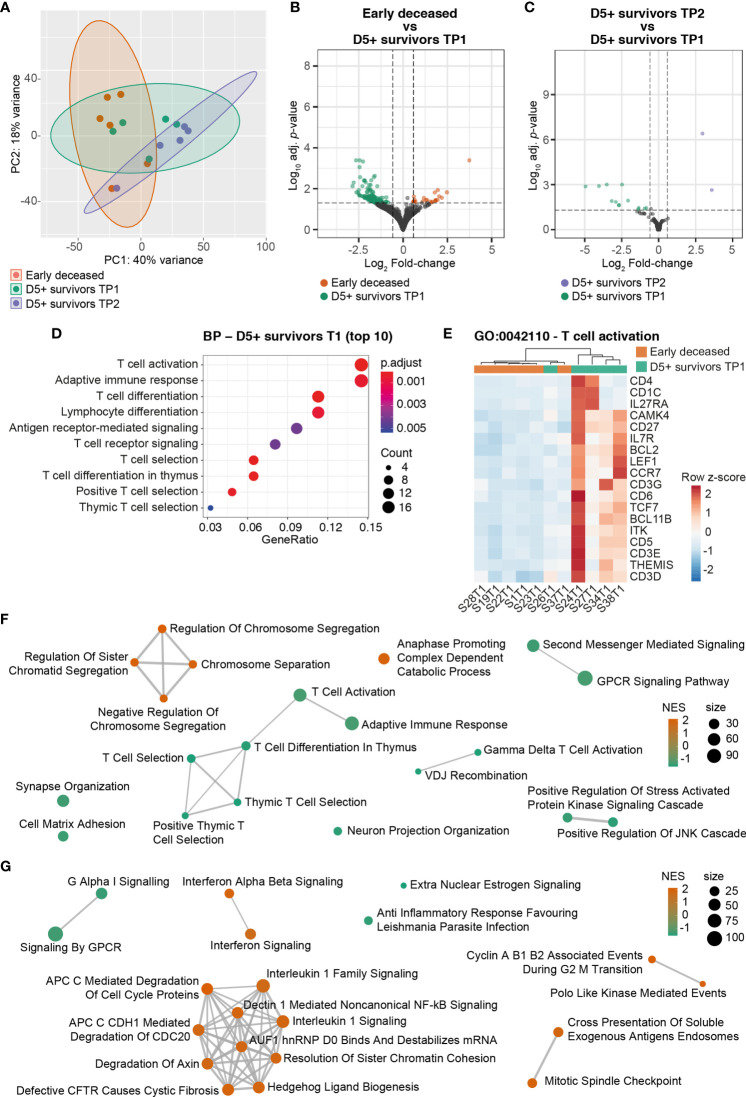
Figure 2.
Transcriptional profiling of PMN isolated from sepsis patients (A) Principal component analysis showing the overall transcriptomic differences between early deceased patients, D5+ survivors at TP1 and TP2. (B) Volcano plot showing the DEGs identified comparing early deceased patients with D5+ survivors at TP1. (C) Volcano plot showing the DEGs identified comparing D5+ survivors at TP2 and D5+ survivors at TP1. (D) Top 10 results (ordered by adjusted P value) of the Gene Ontology analysis performed on the Biological Process (BP) database with the DEGs associated to D5+ survivors at TP1, compared to early deceased patients. (E) Heatmap showing the expression level of the different DEGs identified in the Gene Ontology term G0:0042110 – T cell activation. (F) Graphical representation of the top 15 enriched terms on Biological Process based on the GSEA analysis on early deceased patients and D5+ survivors at TP1. Positive NES associate with early deceased patients, negative NES associate with D5+ survivors at TP1. (G) Graphical representation of the top 15 enriched terms on Reactome based on the GSEA analysis on early deceased patients and D5+ survivors at TP1. Positive NES associate with early deceased patients, negative NES associate with D5+ survivors at TP1.

