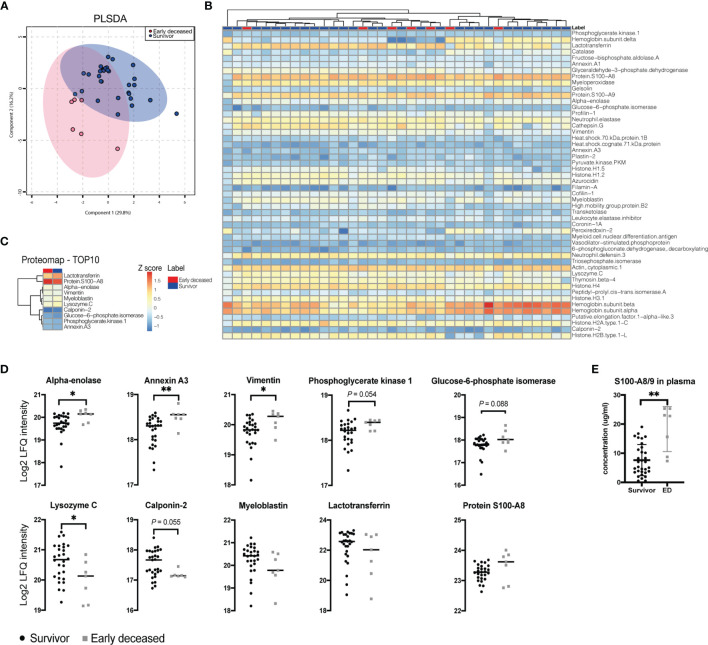
Figure 4.
Overview and analysis of proteomics data. (A) Partial least squares discriminant analysis (PLSDA) revealed the difference between the groups of Early deceased patients and day 5+ survivors. (B) Heatmap showing the global expression of all the detected proteins. (C) Heat map showing 10 of the most differentially expressed proteins based on P value. (D) The LFQ intensities of the top 10 proteins were quantified and showed significant changes in alpha-enolase, Annexin A3, Vimentin, and Lysozyme (E) Plasma levels of alarmins S100A8/9 measured by ELISA. Data were tested with the Mann-Whitney test, error bars show SD. *(P <0.05), **(P <0.01).

