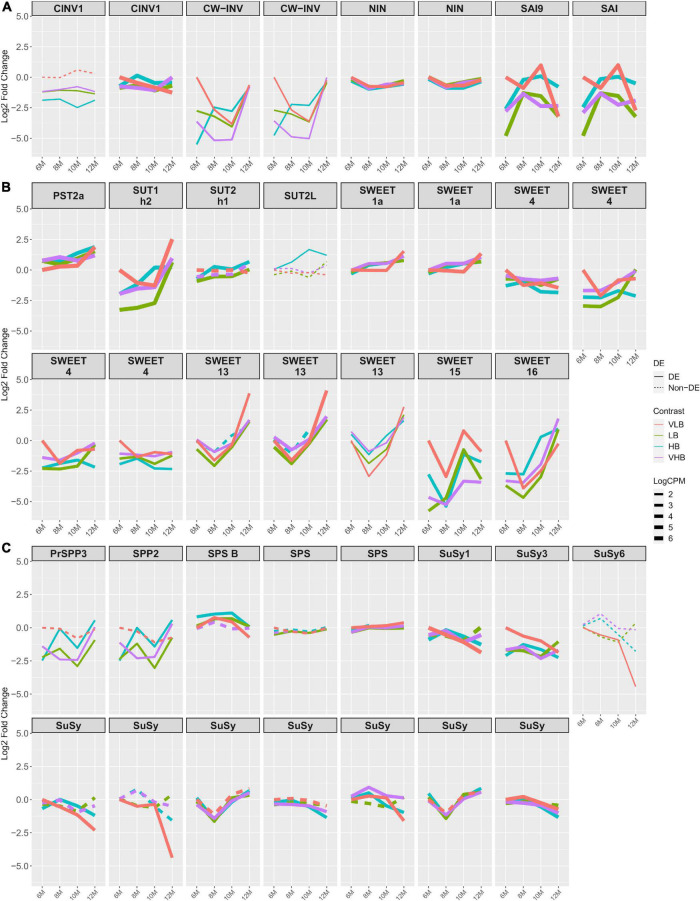
FIGURE 2.
Expression profiles of genes related to sucrose metabolism. The x axis shows the age of plants (in months). The y axis corresponds to the log fold change in comparison to the very low °Brix (VLB) genotype in T1 (6-month-old plants). Each line represents a gene and the solid lines indicate genes with significant differential expression in at least at one time point, while dashed lines represent genes with no differential expression for a given genotype. The line width indicates the average expression level of each gene, with more highly expressed genes thicker. (A) Invertase genes, where CINV, CW-INV, NIN, and SAI correspond to cytosolic invertase, cell wall invertase, alkaline/neutral invertase and soluble acid invertase, respectively. (B) Genes responsible for sugar transport, with PST, SUT and SWEET corresponding to putative sugar transporter, sucrose transporter and bidirectional sugar transporter SWEET, respectively. (C) Genes involved in sucrose metabolism, where PrSPP, SPP, SPS and SuSy correspond to probable sucrose phosphate phosphatase, sucrose phosphate phosphatase, sucrose phosphate synthase and sucrose synthase, respectively. VLB: very low °Brix, LB: low °Brix, HB: high °Brix and VHB: very high °Brix.

