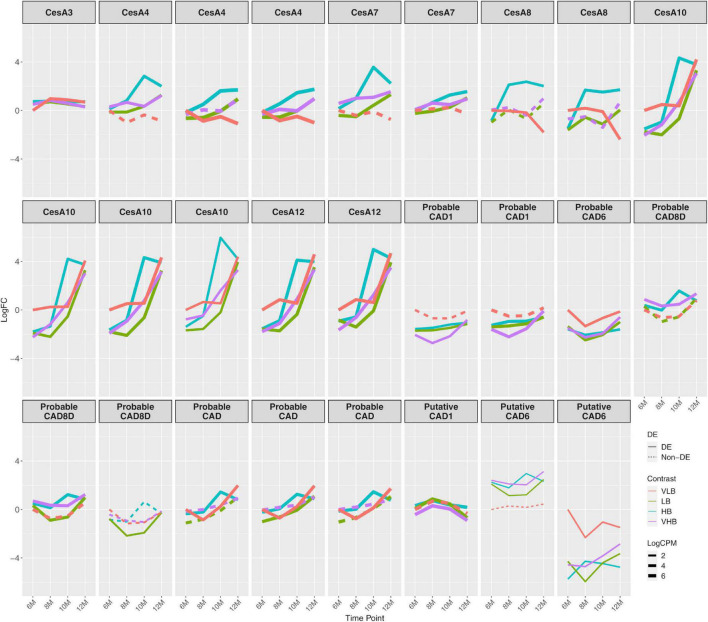
FIGURE 3.
Expression profiles of genes related to the biosynthesis of cell wall components. The x axis shows the age of plants (in months). The y axis corresponds to the log fold change in comparison to the very low °Brix (VLB) genotype in T1 (6-month-old plants). Each line represents a gene and the solid lines indicate genes with significant differential expression in at least at one time point, while dashed lines represent genes with no differential expression for a given genotype. The line width indicates the average expression level of each gene, with more highly expressed genes thicker. CesA and CAD correspond to cellulose synthase and cinnamyl alcohol dehydrogenase, respectively. VLB: very low °Brix, LB: low °Brix, HB: high °Brix and VHB: very high °Brix.

