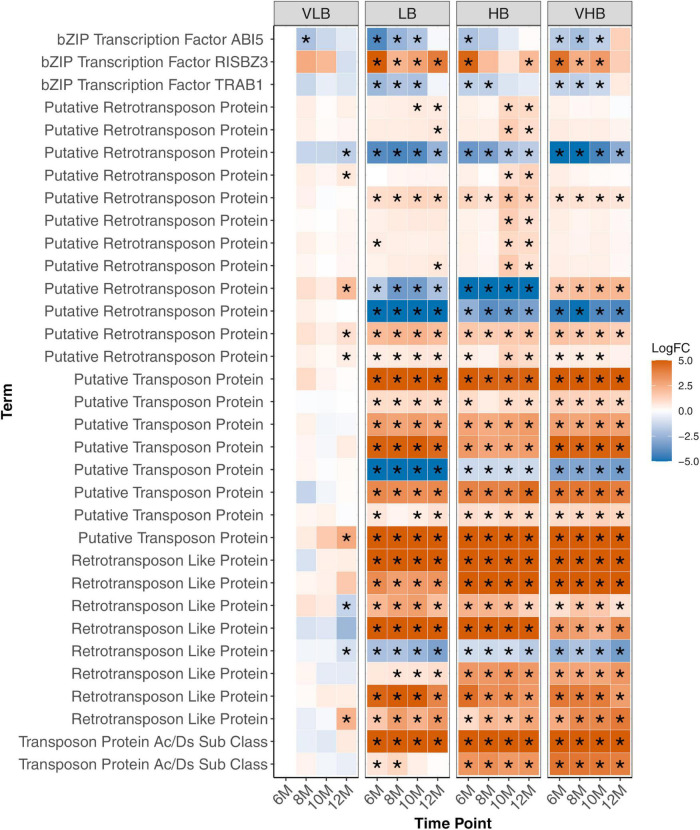
FIGURE 5.
Expression profiles of genes involved in response to stress. Asterisks indicate genes with differential expression for a particular combination of genotype and time point. The age of plants in the x axis is shown in months. VLB: very low °Brix, LB: low °Brix, HB: high °Brix and VHB: very high °Brix. All tests considered 6-month-old VLB as a reference group.

