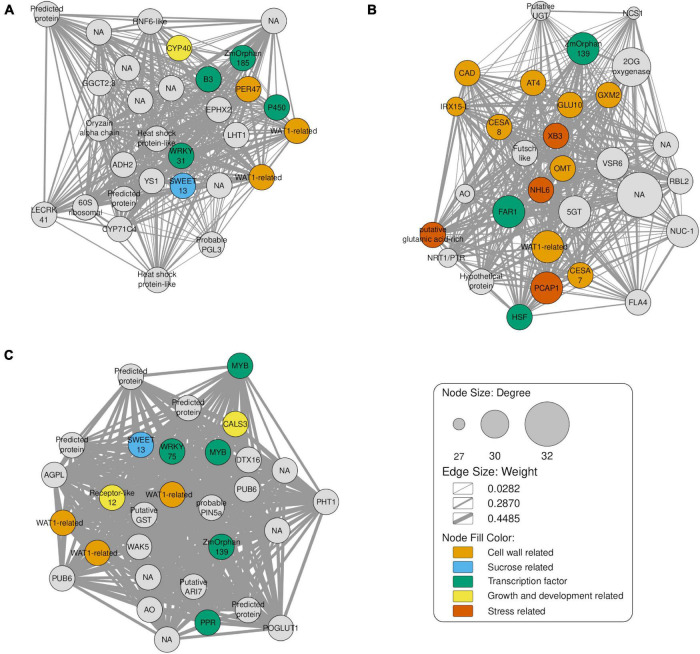
FIGURE 6.
Gene co-expression network of the top 30 hub genes, as indicated by the maximal clique centrality. The node sizes represent the degree of correlation with other genes. Light orange, light blue, green, yellow, orange nodes represent cell wall related, sucrose related, transcription factor, growth and development related and stress related genes, respectively. The edges represent interactions between genes and their width indicates the corresponding weight. (A) Comparison of T2 (8-months) against T1 (6-month-old plants). (B) Comparison of T3 (10-months) against T1. (C) Comparison T4 (12-months) vs. T1.

