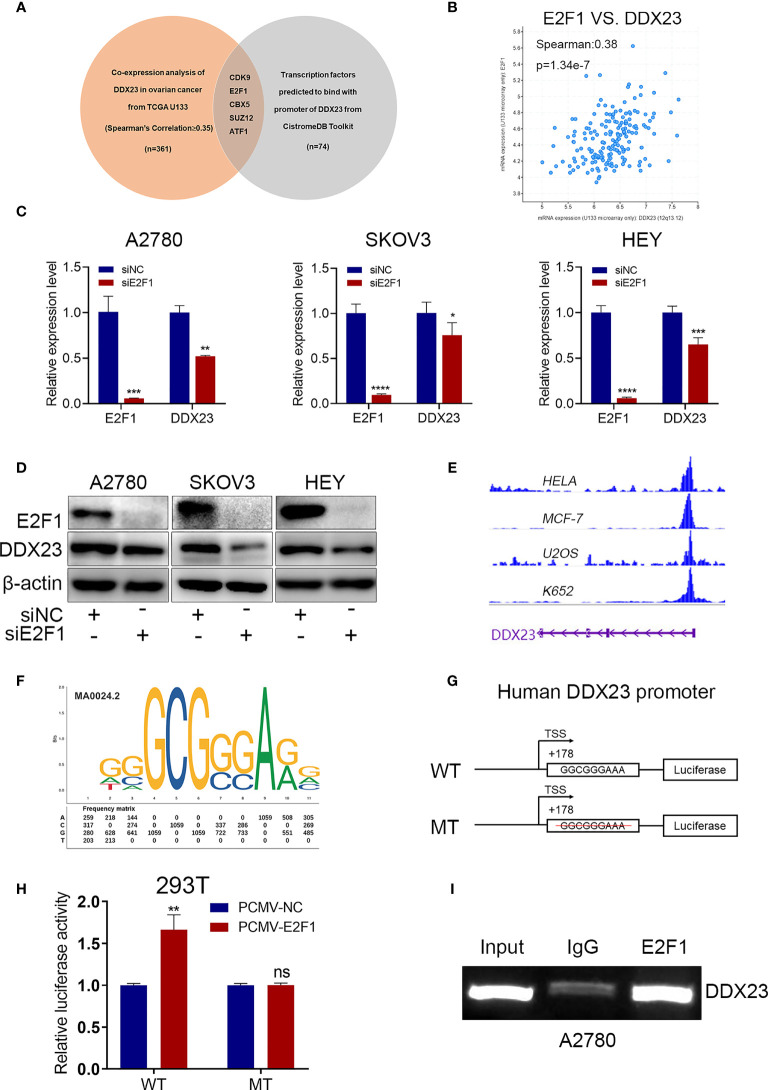
Figure 5.
E2F1 activated DDX23 transcription in ovarian cancer cells. (A) Venn diagram of 5 hub TFs positively related to DDX23 expression (TCGA U133 microarray, Spearman’s Correlation ≥ 0.35) and predicted to bind with the promoter of DDX23. (B) Co-expression analysis between DDX23 and E2F1 expression in ovarian cancer based on the cBioPortal database. (C, D) The mRNA and protein levels of E2F1 and DDX23 in ovarian cancer cells with or without E2F1 knockdown were measured by qRT-PCR (C) and Western blotting (D). (E) Visualization of E2F1 binding peaks. The binding peaks of E2F1 were enriched in the promoter region of DDX23 in HELA, MCF-7, U2OS, and K652 cell lines based on ChIP-seq data from the Cistrome Data Brower. (F) The sequence logo of a potential E2F1 binding site on DDX23 promoter predicted by JASPAR. (G) Schematic diagram of the DDX23 WT and MT promoter sequences. (H) Dual-luciferase reporter assays showing that E2F1 overexpression increased the luciferase activity in HEK293T cells transfected with the DDX23 promoter WT plasmid, but not in cells with MT plasmid. (I) ChIP assay and semi-quantitative PCR analysis showed that E2F1 could bind to the DDX23 promoter region directly. TFs, transcription factors; ChIP, Chromatin immunoprecipitation; WT, wild type; MT, mutant type. Data are presented as mean ± SEM. ns, no significant, *P < 0.05, **P < 0.01, ***P < 0.001, ****P < 0.0001.

