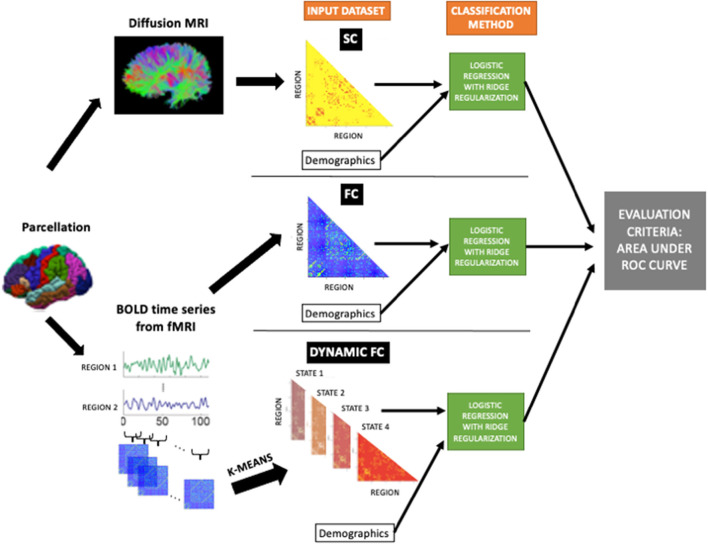
Figure 1.
The workflow of the study. Structural connectomes (SC), static functional connectomes (FC), and dynamic functional connectome (dFC) metrics were used as input, in addition to the demographics/clinical variables, to the classification model (logistic regression with ridge regularization technique). The classification performance of each model was assessed using the area under the ROC curve (AUC).

