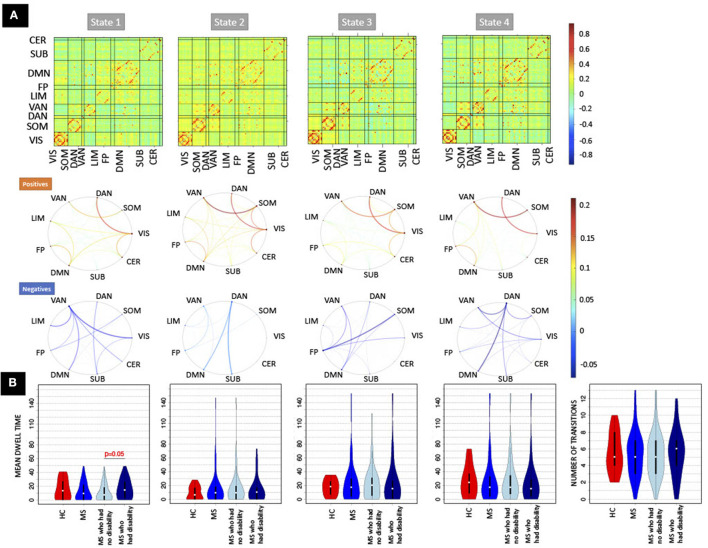
Figure 2.
The recurring dynamic FC brain states obtained with k-means clustering and the dFC metrics (dwell time and number of transitions). (A) (Top row) Heat maps show the dynamic functional connectivity centroids for the four states, while [bottom two rows of (A)] the circle plots summarize the dFC centroids at a network level with the positive and negative dFC entries averaged separately. The color bar of the circle plot is not symmetrical, as to better visualize the network-level values. (B) The dFC metrics (mean dwell time and number of transitions) obtained for HC, pwMS, pwMS who had no disability, and pwMS who had evidence of disability. DAN, Dorsal Attention; VAN, Ventral Attention; LIM, Limbic; FP, Fronto-Parietal; DMN, Default-Mode Network; SUB, Subcortex; CER, Cerebellum; VIS, Visual; SOM, Somatomotor.

