Figure 3.
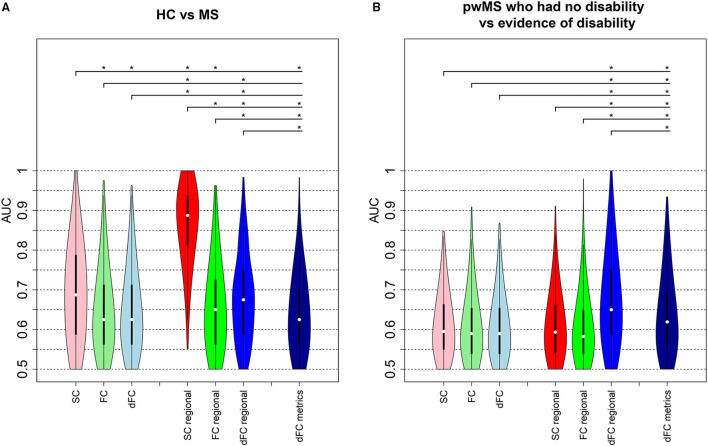
Classification analysis results. AUC values obtained from the models classifying (A) HC vs. pwMS and (B) pwMS according to their disability level. The first three violin plots show the AUC results from the models including pairwise connectivity information. The number of the imaging variables was 3,655 for pairwise SC and FC, while 14,620 (= 3655 × 4 dFC states) variables included in the pairwise dFC model. The next set of three violin plots show the AUC values from the regional models where regional SC and FC models each included 86 imaging variables and the regional dFC model included 344 (= 86 × 4 dFC states) imaging variables. The last model that included dFC metrics contained 21 imaging variables. The plots show the median (white dot), 1st and 3rd quartiles (black bar) over the 500 hold-out test sets. Asterisks indicate significant differences (p <0.05, BH corrected) in the distribution of AUC values between different models.

