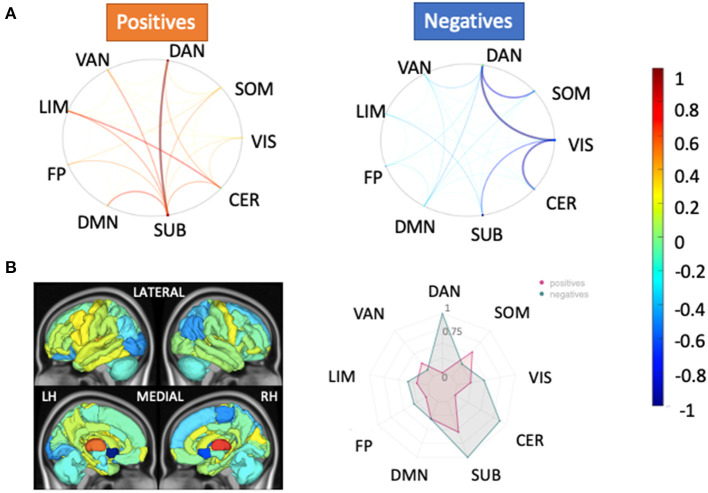
Figure 4.
Relative feature weights of the SC models for the HC vs. pwMS classification task. The relative feature weights (scaled by the maximum magnitude feature weight) for the variables used in the two models with the best classification performance in the HC vs. pwMS task: (A) pairwise SC and (B) regional SC (node strength). The circle plots in (A) illustrate the positive (hot colors) and negative (cool colors) model feature weights, respectively, for the pairwise SC model, averaged across the Yeo functional networks. The glass brain and radial plot figures in (B) show the relative feature weights from the regional SC (node strength) model, where the redial plot shows the positive and negative values averaged over the Yeo functional networks. Negative values (cooler colors) indicate those connections where larger values were associated with greater probability of being in the HC group while positive values (hotter colors) indicate those connections where larger values were associated with greater probability of being in the pwMS group. DAN, dorsal attention; VAN, ventral attention; LIM, limbic; FP, fronto-parietal; DMN, default-mode network; SUB, subcortex; CER, cerebellum; VIS, visual; SOM, somato-motor.

