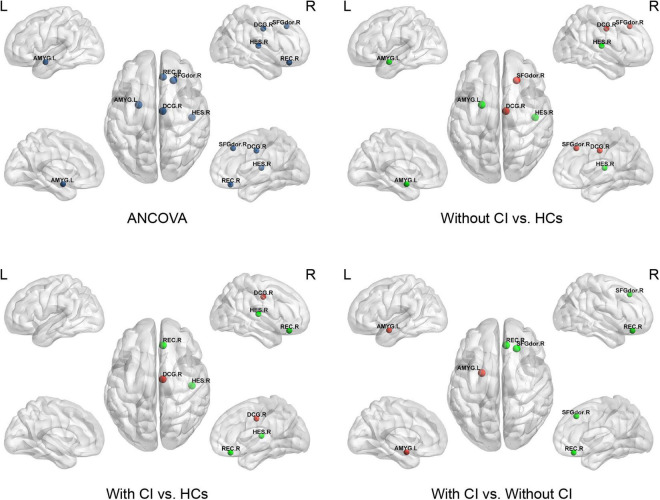
FIGURE 3.
This figure shows significant differences in nodal local efficiency (NLe) among the three groups. Dark blue indicates the nodes with differences among the three groups using ANCOVA. Red represents a significant increase and green represents a significant decrease (p < 0.05, Bonferroni corrected). SFGdor, superior frontal gyrus dorsolateral; REC, gyrus rectus; DCG, median cingulate and paracingulate gyri; AMYG, amygdala; HES, Heschl’s gyrus.

