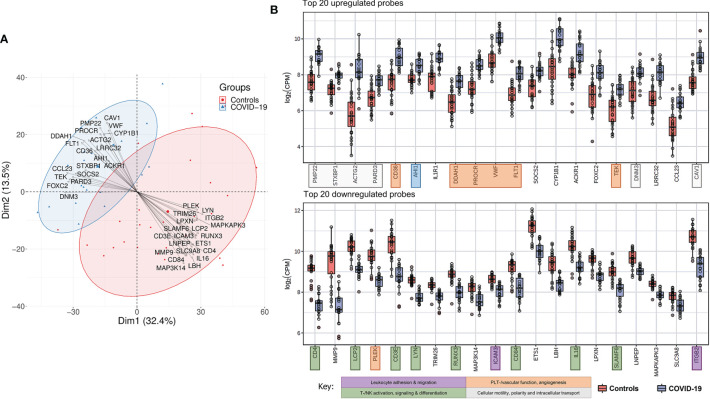
Figure 4.
Characteristic Gene Expression Profiling of COVID-19 Lymph Nodes. (A) Principal component analysis biplot showing distinct clustering of COVID-19 and controls in whole tissue analysis. Top up- and downregulated genes are superimposed as vectors determining the individual clusters. (B) Top 20 up-regulated genes in COVID-19 versus controls: genes related to cellular structure, motility and intracellular transport, proangiogenic and prothrombotic genes were predominantly upregulated in COVID-19. Genes involved in T-/NK- and B-cell differentiation and signaling and leukocyte trafficking were predominantly down-regulated in COVID-19.

