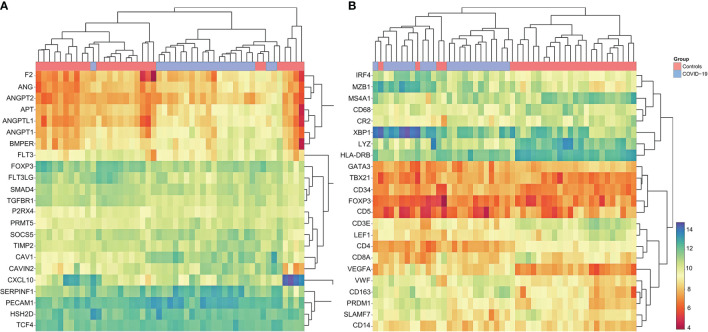
Figure 6.
Cluster Analysis of Gene Expression Profiling in COVID-19. (A) Marked dysregulation of angiogenesis-related genes in COVID-19 compared to controls; upregulation of ANG, ANGPT2, AGT, ANGPTL1 ANGPT1, BMPER, SERPINF1 and PECAM1; note that COVID-19 cases cluster together, indicating concordance between individual cases. Individual p-values to be found in Supplementary Materials 2.5 . (B) Customized gene set enrichment and clustering analysis of related markers analyzed also by immunohistochemistry shows distinct clustering between COVID-19 and controls: downregulation of CR2 (encodes CD21), TBX21 (encodes Tbet) and LEF1; upregulation of plasmablast genes IRF4, MZB1, XBP1, PRDM1 and SLAMF7; upregulation of angiogenesis related genes (CD34 and VEGF) and of VWF; downregulation of LYZ (encoding for lysozyme) and upregulation of CD163 indicating M2 polarization of macrophages. Note that COVID-19 cases cluster together, indicating concordance between individual cases.

