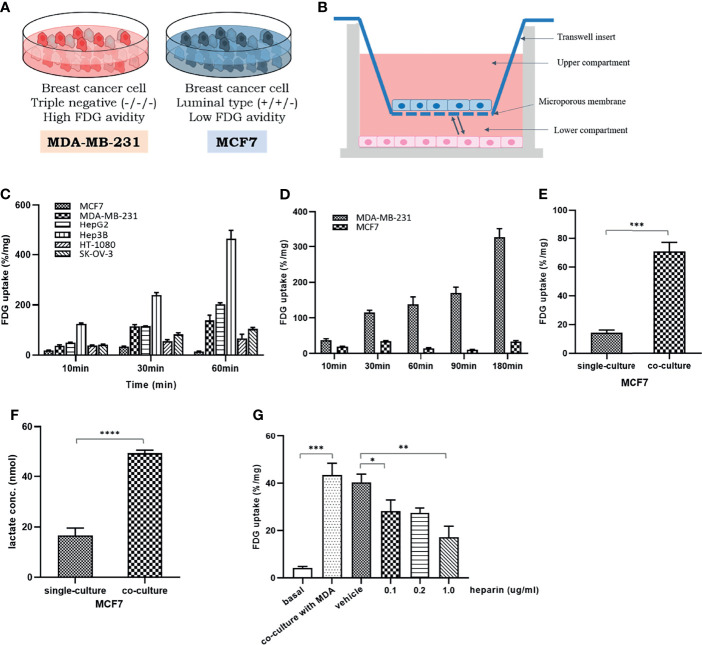
Figure 1.
The change of glucose uptake in the MCF7 cells after coculture with MDA-MB-231 cells: (A) Two different breast cancer cell lines with different glycolytic activity, MDA-MB-231 and MCF7 cells; (B) A schematic figure of a 24-well Transwell insert with a 0.4-μm pore size for indirect coculture; (C) Baseline FDG uptake of various cancer cell lines, MCF7, MDA-MB-231, HepG2, Hep3B, HT-1080, and SK-OV-3, cultured up to 60 min. It can be seen that there are different levels of FDG uptake among several cancer cells within a limited time; (D) Baseline FDG uptake of two breast cancer cell lines, MDA-MB-231 and MCF7 cells, cultured up to 180 min. Over time, the FDG uptake of MDA-MB-231 cells increases significantly, but in MCF7 cells, it tends to rise and fall little by little; (E) FDG uptake in MCF7 cells increased after coculture with MDA-MB-231 cells; (F) After coculture with MDA-MB-231 cells, the amount of lactate in the culture medium was significantly increased in MCF7 cells, which implies the increase in FDG uptake by activation of aerobic glycolysis; (G) The increase of FDG uptake in MCF7 cells was dose-dependent suppressed by heparin administration known to inhibit EV uptake in recipient cells. MCF7, human luminal type breast cancer cell; MDA-MB-231, human triple negative breast cancer cell, HepG2, human hepatocellular carcinoma; Hep3B, human hepatocellular carcinoma; HT-1080, human fibrosarcoma cell; SK-OV-3, human ovarian cancer cell. FDG, 18F-fluorodeoxyglucose, which is a glucose analog; Bars with standard deviation (n = 3, biologically independent samples) indicate average FDG uptake of each cell. Asterisks indicate P values *P < 0.05, **P < 0.01, ***P < 0.005, and ****P < 0.0001.

