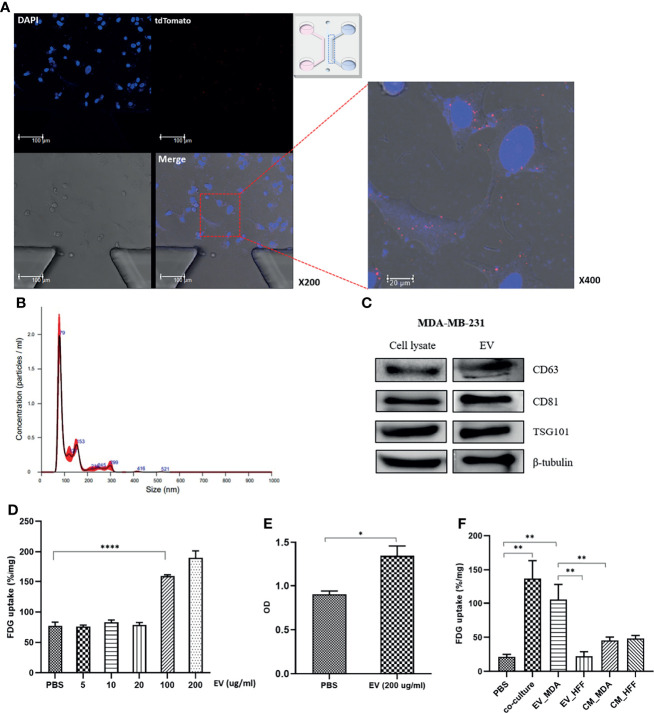
Figure 2.
MDA-MB-231 cell–derived EVs impacts for activation of glucose uptake in MCF7 cells: (A) Confocal microscopy images of the microfluidic chip show tdTomato-labeled EVs signals inside MCF7 cells; (B) Nanoparticle tracking analysis (NTA) of isolated EVs from MDA-MB-231. The main peaks are located between 80-150nm; (C) Western blotting of EV-specific proteins, CD63, CD81, and TSG101. For verification of the isolated EVs, western blots were conducted in cell lysate and EV pellets; (D) FDG uptake of MCF7 cells increased in proportion to the dose after administration of the isolated EVs. Although there was no significant change until 20 µg/mL, it showed a significant increase in more than 100 µg/mL; (E) CCK8 assay shows increased cell proliferation of MCF7 cells after administration of the isolated EVs from MDA-MB-231; (F) The effect of MDA-MB-231-mediated EVs compared to control groups, EV-deprived conditioned medium and HFF-derived EVs. EVs of concentration of 100 ug/ml was used for the comparison. HFF-derived EVs failed to induce a significant increase of FDG uptake in MCF7 cells. Both EV-deprived conditioned media increased FDG uptake, but it was judged that there was a high possibility of change due to non-specific factors; EV_MDA, EVs isolated from MDA-MB-231; EV_HFF, EVs isolated from HFF; CM_MDA, EV-depleted conditioned media from MDA-MB-231; CM_HFF, EV-depleted conditioned media. Bars with standard deviation (n = 3, biologically independent samples) indicate average FDG uptake or absorbance of each sample. Asterisks indicate P values *P < 0.05, **P < 0.01, and ****P < 0.0001.

