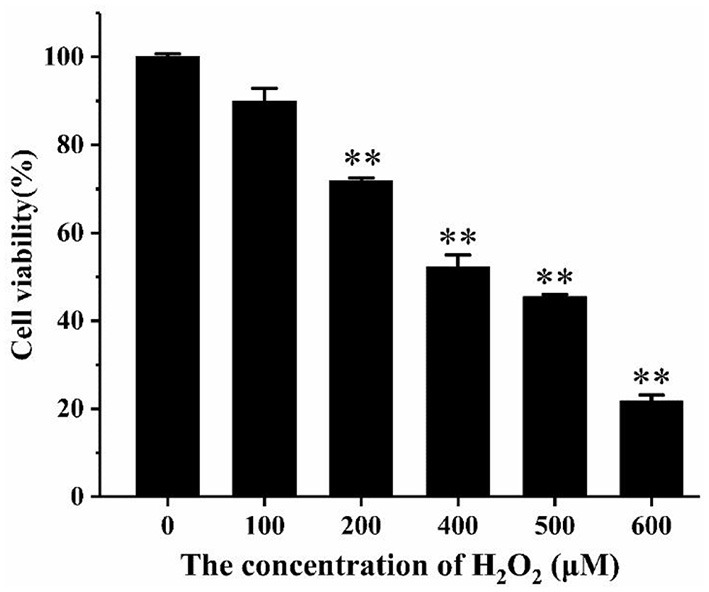
Figure 2.

The effect of H2O2 on the viability of RAW264.7 cells. Cells were treated with different concentrations of H2O2 for 24 h. The results were presented as the mean ± SE of three independent experiments. **P < 0.01 compared with normal cell group (Supplementary Table 9).
